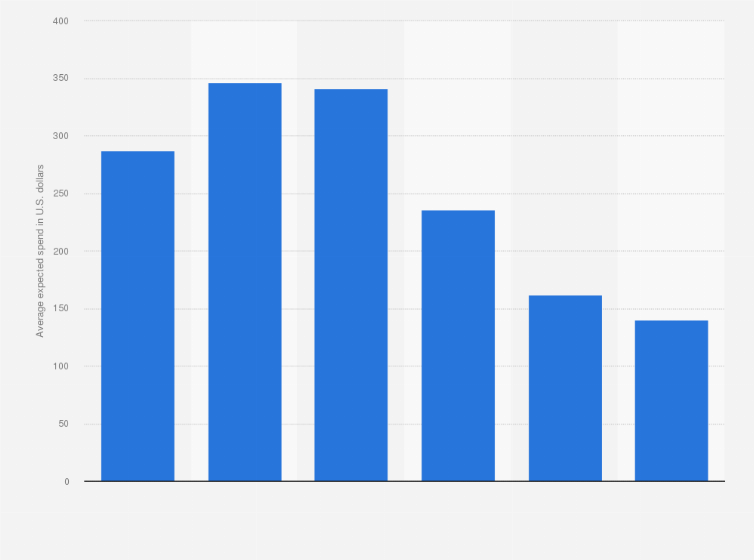
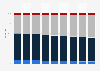
This statistic presents the average amount expected to be spent on Mother's Day in the United States in 2022, by age. U.S. consumers aged between 25 to 34 years planned to spend an average of nearly 350 U.S. dollars on Mother's Day.
Average planned spending on Mother's Day per capita in the United States in 2022, by age group
(in U.S. dollars)
Adjust the presentation of the statistic and data points.
Share the statistic on social media channels or embed the statistic in your
website using "Embed Code", where available.
Cite this statistic and select one of the following formats: APA, Chicago, Harvard, MLA & Bluebook.
Print the statistic including description and metadata.
Chart type
Average planned spending on Mother's Day per capita in the United States in 2022, by age group
Share this statistic
You have no right to use this feature.
Make sure to contact us if you are interested in scientific citation.
You can upgrade your account to enable this functionality for all statistics.
This feature is not available with your current account.Request access
Learn more about how Statista can support your business.
National Retail Federation. (April 21, 2022). Average planned spending on Mother's Day per capita in the United States in 2022, by age group (in U.S. dollars) [Graph]. In Statista. Retrieved May 07, 2025, from https://www.statista.com/statistics/1002737/us-mother-s-day-expected-expenditure-by-age/
National Retail Federation. "Average planned spending on Mother's Day per capita in the United States in 2022, by age group (in U.S. dollars)." Chart. April 21, 2022. Statista. Accessed May 07, 2025. https://www.statista.com/statistics/1002737/us-mother-s-day-expected-expenditure-by-age/
National Retail Federation. (2022). Average planned spending on Mother's Day per capita in the United States in 2022, by age group (in U.S. dollars). Statista. Statista Inc.. Accessed: May 07, 2025. https://www.statista.com/statistics/1002737/us-mother-s-day-expected-expenditure-by-age/
National Retail Federation. "Average Planned Spending on Mother's Day per Capita in The United States in 2022, by Age Group (in U.S. Dollars)." Statista, Statista Inc., 21 Apr 2022, https://www.statista.com/statistics/1002737/us-mother-s-day-expected-expenditure-by-age/
National Retail Federation, Average planned spending on Mother's Day per capita in the United States in 2022, by age group (in U.S. dollars) Statista, https://www.statista.com/statistics/1002737/us-mother-s-day-expected-expenditure-by-age/ (last visited May 07, 2025)
Average planned spending on Mother's Day per capita in the United States in 2022, by age group (in U.S. dollars) [Graph], National Retail Federation, April 21, 2022. [Online]. Available: https://www.statista.com/statistics/1002737/us-mother-s-day-expected-expenditure-by-age/
Profit from additional features with an Employee Account
Please create an employee account to be able to mark statistics as favorites.
Then you can access your favorite statistics via the star in the header.
Profit from the additional features of your individual account
Currently, you are using a shared account. To use individual functions (e.g., mark statistics as favourites, set
statistic alerts) please log in with your personal account.
If you are an admin, please authenticate by logging in again.