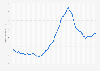
This statistic shows the annual percentage variation of output prices in the paper sector in Italy from 2017 to 2018 as well as the estimated figures from 2019 to 2021. According to data provided by Prometeia, in 2017 and in 2018, the output prices increased by 0.8 percent and 4.7 percent, respectively. The prices are expected to decrease in the following years.
Advertisement
Advertisement
Annual percentage variation of output prices in the paper sector in Italy from 2017 to 2021
Adjust the presentation of the statistic and data points.
Share the statistic on social media channels or embed the statistic in your
website using "Embed Code", where available.
Cite this statistic and select one of the following formats: APA, Chicago, Harvard, MLA & Bluebook.
Print the statistic including description and metadata.
Chart type
Annual percentage variation of output prices in the paper sector in Italy from 2017 to 2021
Share this statistic
You have no right to use this feature.
Make sure to contact us if you are interested in scientific citation.
You can upgrade your account to enable this functionality for all statistics.
This feature is not available with your current account.Request access
Data refer to the following NACE Classification codes 17.11 – Manufacture of pulp; 17.12 - Manufacture of paper and paperboard. *The date of survey refers to consolidated figures. The data for the years 2019 to 2021 were estimated by the source.
Learn more about how Statista can support your business.
Prometeia. (June 19, 2019). Annual percentage variation of output prices in the paper sector in Italy from 2017 to 2021 [Graph]. In Statista. Retrieved June 12, 2025, from https://www.statista.com/statistics/1007880/y-o-y-variation-of-output-prices-in-the-paper-sector-in-italy/
Prometeia. "Annual percentage variation of output prices in the paper sector in Italy from 2017 to 2021." Chart. June 19, 2019. Statista. Accessed June 12, 2025. https://www.statista.com/statistics/1007880/y-o-y-variation-of-output-prices-in-the-paper-sector-in-italy/
Prometeia. (2019). Annual percentage variation of output prices in the paper sector in Italy from 2017 to 2021. Statista. Statista Inc.. Accessed: June 12, 2025. https://www.statista.com/statistics/1007880/y-o-y-variation-of-output-prices-in-the-paper-sector-in-italy/
Prometeia. "Annual Percentage Variation of Output Prices in The Paper Sector in Italy from 2017 to 2021." Statista, Statista Inc., 19 Jun 2019, https://www.statista.com/statistics/1007880/y-o-y-variation-of-output-prices-in-the-paper-sector-in-italy/
Prometeia, Annual percentage variation of output prices in the paper sector in Italy from 2017 to 2021 Statista, https://www.statista.com/statistics/1007880/y-o-y-variation-of-output-prices-in-the-paper-sector-in-italy/ (last visited June 12, 2025)
Annual percentage variation of output prices in the paper sector in Italy from 2017 to 2021 [Graph], Prometeia, June 19, 2019. [Online]. Available: https://www.statista.com/statistics/1007880/y-o-y-variation-of-output-prices-in-the-paper-sector-in-italy/
Advertisement
Profit from additional features with an Employee Account
Please create an employee account to be able to mark statistics as favorites.
Then you can access your favorite statistics via the star in the header.
Profit from the additional features of your individual account
Currently, you are using a shared account. To use individual functions (e.g., mark statistics as favourites, set
statistic alerts) please log in with your personal account.
If you are an admin, please authenticate by logging in again.