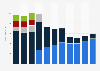
In the secibd quarter of 2024, the revenue generated from Garmin's fitness segment amounted to almost 430 million U.S. dollars, an increase compared to the previous quarter, when it generated around 428.5 million U.S. dollars.
Advertisement
Advertisement
Quarterly revenue of Garmin from 2017 to 2024, by segment
(in million U.S. dollars)
Characteristic
Fitness
Outdoor
Aviation
Auto
Marine
1Q '17
137.83
115.88
122.87
160.49
104.45
2Q '17
181.02
194.78
124.06
223.08
108.55
3Q '17
167.15
184.94
124.63
197.22
77.31
4Q '17
276.2
203.28
129.8
204.35
83.7
1Q '18
166.04
144.26
145.71
141.21
113.55
2Q '18
225.1
201.64
153.01
180.13
134.58
3Q '18
190.19
209.42
146.43
165.21
98.77
4Q '18
277.01
254.57
158.31
147.56
94.65
1Q '19
180.26
154.05
170.78
127
133.97
2Q '19
251.65
210.4
183.97
157.41
151.41
3Q '19
243.1
258.29
187.57
137.72
107.69
4Q '19
372.52
294.82
193.14
125.97
115.78
1Q '20
223.6
175.1
188.6
105.8
163
Created with Highcharts 7.2.2Net sales in million U.S. dollars137.83137.83181.02181.02167.15167.15276.2276.2166.04166.04225.1225.1190.19190.19277.01277.01180.26180.26251.65251.65243.1243.1372.52372.52223.6223.6294.64294.64328.45328.45470.81470.81308.13308.13413.2413.2342.32342.32470.15470.15220.9220.9272.1272.1279.88279.88336.55336.55244.72244.72334.86334.86352.98352.98412.08412.08342.89342.89428.4428.4115.88115.88194.78194.78184.94184.94203.28203.28144.26144.26201.64201.64209.42209.42254.57254.57154.05154.05210.4210.4258.29258.29294.82294.82175.1175.1206.2206.2334.84334.84411.94411.94256.46256.46323.41323.41323.86323.86378.22378.22384.6384.6381.92381.92340.39340.39388.26388.26328.66328.66448.11448.11434434486.38486.38366.19366.19439.87439.87122.87122.87124.06124.06124.63124.63129.8129.8145.71145.71153.01153.01146.43146.43158.31158.31170.78170.78183.97183.97187.57187.57193.14193.14188.6188.6126.14126.14151.11151.11156.97156.97173.89173.89180.83180.83180.17180.17177.58177.58174.77174.77204.74204.74188.04188.04225.25225.25213.58213.58217.45217.45198.16198.16217.13217.13216.86216.86218.25218.25160.49160.49223.08223.08197.22197.22204.35204.35141.21141.21180.13180.13165.21165.21147.56147.56127127157.41157.41137.72137.72125.97125.97105.8105.885.0685.06129.36129.36140.11140.11124.49124.49147.68147.68138.1138.1169.19169.19138.33138.33139.29139.29135.62135.62145.69145.6981.4881.48104.56104.56110.15110.15127.03127.03128.97128.97147.19147.19104.45104.45108.55108.5577.3177.3183.783.7113.55113.55134.58134.5898.7798.7794.6594.65133.97133.97151.41151.41107.69107.69115.78115.78163163157.83157.83165.44165.44171.58171.58209.37209.37261.79261.79207.53207.53196.54196.54254.07254.07242.79242.79196.51196.51210.61210.61278.98278.98215.8215.8182.25182.25239.89239.89326.74326.74272.95272.95641.52641.52831.49831.49751.25751.25897.33897.33710.77710.77894.46894.46810.02810.02932.1932.1766.06766.06954.84954.84934.37934.371,102.231,102.23856.1856.1869.87869.871,109.21,109.21,351.411,351.411,072.341,072.341,326.911,326.911,191.981,191.981,391.681,391.681,172.671,172.671,240.841,240.841,140.441,140.441,306.361,306.361,147.421,147.421,320.781,320.781,277.541,277.541,482.511,482.511,381.651,381.651,506.661,506.66FitnessOutdoorAviationAutoMarine1Q '172Q '173Q '174Q '171Q '182Q '183Q '184Q '181Q '192Q '193Q '194Q '191Q '202Q '203Q '204Q '201Q '212Q '213Q '214Q '211Q '222Q '223Q '224Q '221Q '232Q '233Q '234Q '231Q '242Q '24
You have no right to use this feature.
Make sure to contact us if you are interested in scientific citation.
You can upgrade your account to enable this functionality for all statistics.
This feature is not available with your current account.Request access
Learn more about how Statista can support your business.
Garmin. (July 30, 2024). Quarterly revenue of Garmin from 2017 to 2024, by segment (in million U.S. dollars) [Graph]. In Statista. Retrieved June 20, 2025, from https://www.statista.com/statistics/1008102/quarterly-net-sales-of-garmin-by-segment/
Garmin. "Quarterly revenue of Garmin from 2017 to 2024, by segment (in million U.S. dollars)." Chart. July 30, 2024. Statista. Accessed June 20, 2025. https://www.statista.com/statistics/1008102/quarterly-net-sales-of-garmin-by-segment/
Garmin. (2024). Quarterly revenue of Garmin from 2017 to 2024, by segment (in million U.S. dollars). Statista. Statista Inc.. Accessed: June 20, 2025. https://www.statista.com/statistics/1008102/quarterly-net-sales-of-garmin-by-segment/
Garmin. "Quarterly Revenue of Garmin from 2017 to 2024, by Segment (in Million U.S. Dollars)." Statista, Statista Inc., 30 Jul 2024, https://www.statista.com/statistics/1008102/quarterly-net-sales-of-garmin-by-segment/
Garmin, Quarterly revenue of Garmin from 2017 to 2024, by segment (in million U.S. dollars) Statista, https://www.statista.com/statistics/1008102/quarterly-net-sales-of-garmin-by-segment/ (last visited June 20, 2025)
Quarterly revenue of Garmin from 2017 to 2024, by segment (in million U.S. dollars) [Graph], Garmin, July 30, 2024. [Online]. Available: https://www.statista.com/statistics/1008102/quarterly-net-sales-of-garmin-by-segment/
Advertisement
Profit from additional features with an Employee Account
Please create an employee account to be able to mark statistics as favorites.
Then you can access your favorite statistics via the star in the header.
Profit from the additional features of your individual account
Currently, you are using a shared account. To use individual functions (e.g., mark statistics as favourites, set
statistic alerts) please log in with your personal account.
If you are an admin, please authenticate by logging in again.