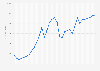
The average nominal salary in Russia was measured at ****** Russian rubles per month in 2024, marking an increase of roughly ****** Russian rubles compared to the previous year. After the currency redenomination and the financial default in 1998, the average wage levels in the country have grown exponentially.
Who gets paid more in Russia?
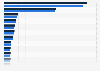
The Russian oil and gas industry paid the highest average wage to their employees, at ******* Russian rubles between January and September 2021. Salaries in management and management consulting were the second-highest, followed by air transportation and software development. On average, men earned more than women across all industries in the country. For example, in the information and communications sector, the average wage of a male worker amounted to nearly ******* Russian rubles, compared to under ****** Russian rubles for a female worker.
Economic inequality in Russia
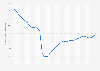
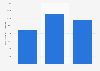
The national income distribution of Russian households shows a high concentration of income and wealth in the hands of few individuals. In 2021, the mean income of the top one percent exceeded******* euros before income tax, compared to ***** euros earned by the bottom 50 percent of the population. Furthermore, the richest one percent in Russia held an average wealth of over *** billion euros, whereas the personal wealth of the bottom 50 percent was measured at ***** euros in the same year. However, the income gap was forecast to decrease in Russia, with the Gini index expected to decline to **** by 2029.
Profit from the additional features of your individual account
Currently, you are using a shared account. To use individual functions (e.g., mark statistics as favourites, set
statistic alerts) please log in with your personal account.
If you are an admin, please authenticate by logging in again.
Learn more about how Statista can support your business.
Russian Federal State Statistics Service. (February 26, 2025). Average monthly nominal wage in Russia from 1995 to 2024 (in Russian rubles) [Graph]. In Statista. Retrieved June 25, 2025, from https://www.statista.com/statistics/1010660/russia-average-monthly-nominal-wage/
Russian Federal State Statistics Service. "Average monthly nominal wage in Russia from 1995 to 2024 (in Russian rubles)." Chart. February 26, 2025. Statista. Accessed June 25, 2025. https://www.statista.com/statistics/1010660/russia-average-monthly-nominal-wage/
Russian Federal State Statistics Service. (2025). Average monthly nominal wage in Russia from 1995 to 2024 (in Russian rubles). Statista. Statista Inc.. Accessed: June 25, 2025. https://www.statista.com/statistics/1010660/russia-average-monthly-nominal-wage/
Russian Federal State Statistics Service. "Average Monthly Nominal Wage in Russia from 1995 to 2024 (in Russian Rubles)." Statista, Statista Inc., 26 Feb 2025, https://www.statista.com/statistics/1010660/russia-average-monthly-nominal-wage/
Russian Federal State Statistics Service, Average monthly nominal wage in Russia from 1995 to 2024 (in Russian rubles) Statista, https://www.statista.com/statistics/1010660/russia-average-monthly-nominal-wage/ (last visited June 25, 2025)
Average monthly nominal wage in Russia from 1995 to 2024 (in Russian rubles) [Graph], Russian Federal State Statistics Service, February 26, 2025. [Online]. Available: https://www.statista.com/statistics/1010660/russia-average-monthly-nominal-wage/