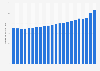
Advertisement
Advertisement
Consumption of cardiovascular system pharmaceuticals in Iceland from 2010 to 2022 (in DDD per 1,000 inhabitants)
Loading statistic...
* For commercial use only
Basic Account
For single users
$0 USD
Always free
Access limited to Free Statistics. Premium Statistics are not included.
Free Statistics
Based on your interests
Starter Account
For single users
$199 USD
per month, billed annually
1
Free Statistics Premium Statistics
Professional Account
For teams of up to 5 people
$1,299 USD
per month, billed annually
1
Free + Premium Statistics Reports Market Insights
1 All prices do not include sales tax. The account requires an annual contract and will renew after one year to the regular list price.
Other statistics that may interest you Statistics on
About the industry
10
- Basic Statistic Cardiovascular system pharmaceutical consumption in Belgium 2010-2021
- Premium Statistic Cardiovascular system daily pharmaceutical consumption in Denmark 2007-2017
- Basic Statistic Cardiovascular system pharmaceutical consumption in Norway 2010-2022
- Basic Statistic Cardiovascular system pharmaceutical consumption in Sweden 2010-2022
- Basic Statistic Antihypertensive pharmaceutical daily consumption in Belgium 2010-2021
- Basic Statistic Antidepressants pharmaceutical consumption in the Netherlands 2010-2021
- Basic Statistic Antidepressants pharmaceutical daily consumption in Germany 2010-2021
- Basic Statistic Antidepressants daily pharmaceutical consumption in Belgium 2010-2021
- Basic Statistic Antidepressants daily pharmaceutical consumption in Austria 2010-2021
- Basic Statistic Number of users of hypertension medicine in Sweden 2023, by age and gender
About the region
10
- Basic Statistic Diabetes pharmaceutical consumption in Iceland 2010-2022
- Premium Statistic Monthly value of blood exports from Iceland 2018
- Premium Statistic Monthly value of blood imports into Iceland 2018
- Basic Statistic Value of pharmaceutical sales in Iceland 2010-2021
- Basic Statistic Monthly value of medicament exports from Iceland 2022-2024
- Basic Statistic Monthly value of medicament imports into Iceland 2022-2023
- Basic Statistic Monthly value of bandage exports from Iceland 2022-2023
- Basic Statistic Monthly value of bandage imports into Iceland 2022-2023
- Premium Statistic Monthly value of pharmaceutical product exports from Iceland 2018
Selected statistics
6
- Basic Statistic Expenditure worldwide on diabetes by market 2013-2018
- Basic Statistic AstraZeneca revenue from product Pulmicort 2006-2024
- Premium Statistic Medicinal market growth worldwide including rebates 2009-2018
- Premium Statistic Chinese insulin market distribution: leading companies 2011
- Premium Statistic U.S. insulin market distribution: leading companies 2011
- Premium Statistic Standard Unit medicine use per capita in the U.S. 2007-2011
Other regions
10
- Premium Statistic Sales value of cardiovascular system drugs in Italy 2011-2023
- Basic Statistic Cardiovascular system pharmaceutical consumption in Netherlands 2010-2021
- Basic Statistic Number of users of cardiovascular medication in Sweden by type 2023
- Premium Statistic Cardiovascular system pharmaceutical consumption in Austria 2010-2017
- Basic Statistic Anxiolytic drug consumption in Europe in 2022
- Basic Statistic Antihypertensive pharmaceutical consumption in Germany 2010-2021
- Basic Statistic Share value of the generic pharmaceuticals market in Finland 2012-2021
- Basic Statistic Cardiovascular system pharmaceutical consumption in Slovenia 2011-2022
- Basic Statistic Diabetes pharmaceutical consumption in Denmark 2011-2021
- Basic Statistic Diabetes pharmaceutical consumption in the United Kingdom 2011-2021
Related statistics
10
- Basic Statistic Expenditure on prescription pharmaceuticals in Sweden 2009-2023
- Basic Statistic Expenditure on nonprescription pharmaceuticals in Sweden 2009-2023
- Basic Statistic Projected most valuable R&D projects based on net present value 2024
- Basic Statistic Top drugs based on projected 2025 global sales
- Basic Statistic Projected top pharmaceutical companies based on new sales 2023
- Basic Statistic Projection of top global pharmaceutical products by revenue growth 2023
- Basic Statistic Projected top pharmaceutical companies based on sales 2023
- Basic Statistic Diabetes pharmaceutical consumption per day in Belgium 2005-2021
- Premium Statistic Atenolol out-of-pocket price in the U.S. 2004-2022
- Premium Statistic Number of atenolol prescriptions in the U.S. 2004-2022
Further related statistics
10
- Sanofi total assets 2019 to 2023
- Merck & Co. R&D expenditure 2006-2024
- Pfizer revenues in the U.S. and abroad 2009-2024
- Johnson & Johnson employees 2004-2024
- Walgreens gross profit and net earnings in the U.S. 2005-2024
- Number of employees at Sinopharm 2011-2022
- Annual revenue of Sinopharm 2010-2024
- Global pharmaceutical pipeline by therapy area 2013-2017
- Alzheimer's amongst older people in 2050: impact of a 5-year delay in onset
- Projected costs of care for older U.S. Alzheimer sufferers 2010-2050
Further Content: You might find this interesting as well
Statistics
- Sanofi total assets 2019 to 2023
- Merck & Co. R&D expenditure 2006-2024
- Pfizer revenues in the U.S. and abroad 2009-2024
- Johnson & Johnson employees 2004-2024
- Walgreens gross profit and net earnings in the U.S. 2005-2024
- Number of employees at Sinopharm 2011-2022
- Annual revenue of Sinopharm 2010-2024
- Global pharmaceutical pipeline by therapy area 2013-2017
- Alzheimer's amongst older people in 2050: impact of a 5-year delay in onset
- Projected costs of care for older U.S. Alzheimer sufferers 2010-2050
* For commercial use only
Basic Account
For single users
$0 USD
Always free
Access limited to Free Statistics. Premium Statistics are not included.
Free Statistics
Based on your interests
Starter Account
For single users
$199 USD
per month, billed annually
1
Free Statistics Premium Statistics
Professional Account
For teams of up to 5 people
$1,299 USD
per month, billed annually
1
Free + Premium Statistics Reports Market Insights
1 All prices do not include sales tax. The account requires an annual contract and will renew after one year to the regular list price.
OECD. (December 8, 2023). Consumption of cardiovascular system pharmaceuticals in Iceland from 2010 to 2022 (in DDD per 1,000 inhabitants) [Graph]. In Statista. Retrieved June 28, 2025, from https://www.statista.com/statistics/1013021/cardiovascular-system-pharmaceuticals-in-iceland/
OECD. "Consumption of cardiovascular system pharmaceuticals in Iceland from 2010 to 2022 (in DDD per 1,000 inhabitants)." Chart. December 8, 2023. Statista. Accessed June 28, 2025. https://www.statista.com/statistics/1013021/cardiovascular-system-pharmaceuticals-in-iceland/
OECD. (2023). Consumption of cardiovascular system pharmaceuticals in Iceland from 2010 to 2022 (in DDD per 1,000 inhabitants). Statista. Statista Inc.. Accessed: June 28, 2025. https://www.statista.com/statistics/1013021/cardiovascular-system-pharmaceuticals-in-iceland/
OECD. "Consumption of Cardiovascular System Pharmaceuticals in Iceland from 2010 to 2022 (in Ddd per 1,000 Inhabitants)." Statista, Statista Inc., 8 Dec 2023, https://www.statista.com/statistics/1013021/cardiovascular-system-pharmaceuticals-in-iceland/
OECD, Consumption of cardiovascular system pharmaceuticals in Iceland from 2010 to 2022 (in DDD per 1,000 inhabitants) Statista, https://www.statista.com/statistics/1013021/cardiovascular-system-pharmaceuticals-in-iceland/ (last visited June 28, 2025)
Consumption of cardiovascular system pharmaceuticals in Iceland from 2010 to 2022 (in DDD per 1,000 inhabitants) [Graph], OECD, December 8, 2023. [Online]. Available: https://www.statista.com/statistics/1013021/cardiovascular-system-pharmaceuticals-in-iceland/
Advertisement