This statistic shows the comparable sales growth of the At Home Group in the United States from fiscal year 2017 to 2019. In 2019, At Home's comparable sales grew by 2.7 percent compared to the previous period.
Advertisement
Advertisement
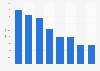
Comparable sales growth of At Home, the home décor superstore, in the United States from fiscal year 2017 to 2019
Fiscal year
Comp sales growth
2019
2.7%
2018
6.5%
2017
3.7%
0%1%2%3%4%5%6%7%8%
Add this content to your personal favorites. These can be accessed from the favorites menu in the main navigation.
You have no right to use this feature.
Make sure to contact us if you are interested in scientific citation.
You can upgrade your account to enable this functionality for all statistics.
This feature is not available with your current account.Request access
Learn more about how Statista can support your business.
At Home. (March 27, 2019). Comparable sales growth of At Home, the home décor superstore, in the United States from fiscal year 2017 to 2019 [Graph]. In Statista. Retrieved June 30, 2025, from https://www.statista.com/statistics/1015324/comp-sales-growth-of-at-home-the-home-decor-superstore-us/
At Home. "Comparable sales growth of At Home, the home décor superstore, in the United States from fiscal year 2017 to 2019." Chart. March 27, 2019. Statista. Accessed June 30, 2025. https://www.statista.com/statistics/1015324/comp-sales-growth-of-at-home-the-home-decor-superstore-us/
At Home. (2019). Comparable sales growth of At Home, the home décor superstore, in the United States from fiscal year 2017 to 2019. Statista. Statista Inc.. Accessed: June 30, 2025. https://www.statista.com/statistics/1015324/comp-sales-growth-of-at-home-the-home-decor-superstore-us/
At Home. "Comparable Sales Growth of At Home, The Home Décor Superstore, in The United States from Fiscal Year 2017 to 2019." Statista, Statista Inc., 27 Mar 2019, https://www.statista.com/statistics/1015324/comp-sales-growth-of-at-home-the-home-decor-superstore-us/
At Home, Comparable sales growth of At Home, the home décor superstore, in the United States from fiscal year 2017 to 2019 Statista, https://www.statista.com/statistics/1015324/comp-sales-growth-of-at-home-the-home-decor-superstore-us/ (last visited June 30, 2025)
Comparable sales growth of At Home, the home décor superstore, in the United States from fiscal year 2017 to 2019 [Graph], At Home, March 27, 2019. [Online]. Available: https://www.statista.com/statistics/1015324/comp-sales-growth-of-at-home-the-home-decor-superstore-us/
Advertisement
Profit from additional features with an Employee Account
Please create an employee account to be able to mark statistics as favorites.
Then you can access your favorite statistics via the star in the header.
Profit from the additional features of your individual account
Currently, you are using a shared account. To use individual functions (e.g., mark statistics as favourites, set
statistic alerts) please log in with your personal account.
If you are an admin, please authenticate by logging in again.