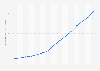
In 2024, the average daily number of online transactions made via payment gateway (PG) in South Korea amounted to around 29.36 million, showing an increase from the previous year. The average daily number of online transactions made via PG in South Korea has increased rapidly in recent years, especially after digital transactions increased during the coronavirus (COVID-19) pandemic.
Profit from the additional features of your individual account
Currently, you are using a shared account. To use individual functions (e.g., mark statistics as favourites, set
statistic alerts) please log in with your personal account.
If you are an admin, please authenticate by logging in again.
Learn more about how Statista can support your business.
Bank of Korea. (March 20, 2025). Average daily number of online transactions made via payment gateway (PG) in South Korea from 2019 to 2024 (in millions) [Graph]. In Statista. Retrieved May 20, 2025, from https://www.statista.com/statistics/1015641/south-korea-payment-gateway-transactions-daily-number/
Bank of Korea. "Average daily number of online transactions made via payment gateway (PG) in South Korea from 2019 to 2024 (in millions)." Chart. March 20, 2025. Statista. Accessed May 20, 2025. https://www.statista.com/statistics/1015641/south-korea-payment-gateway-transactions-daily-number/
Bank of Korea. (2025). Average daily number of online transactions made via payment gateway (PG) in South Korea from 2019 to 2024 (in millions). Statista. Statista Inc.. Accessed: May 20, 2025. https://www.statista.com/statistics/1015641/south-korea-payment-gateway-transactions-daily-number/
Bank of Korea. "Average Daily Number of Online Transactions Made via Payment Gateway (Pg) in South Korea from 2019 to 2024 (in Millions)." Statista, Statista Inc., 20 Mar 2025, https://www.statista.com/statistics/1015641/south-korea-payment-gateway-transactions-daily-number/
Bank of Korea, Average daily number of online transactions made via payment gateway (PG) in South Korea from 2019 to 2024 (in millions) Statista, https://www.statista.com/statistics/1015641/south-korea-payment-gateway-transactions-daily-number/ (last visited May 20, 2025)
Average daily number of online transactions made via payment gateway (PG) in South Korea from 2019 to 2024 (in millions) [Graph], Bank of Korea, March 20, 2025. [Online]. Available: https://www.statista.com/statistics/1015641/south-korea-payment-gateway-transactions-daily-number/