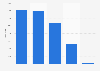
In 2022, the average sales of meat snacks in convenience stores in the United States was 14,555 U.S. dollars per store. Average sales per store of health/energy bars totaled 5,045 U.S. dollars.
Advertisement
Advertisement
Average per store sales of alternative snacks in convenience stores in the United States in 2022, by category
(in U.S. dollars)
Characteristic
Average sales per store in U.S. dollars
Meat snacks
14,555
Health/ energy bars
5,045
Granola/ yogurt bars
1,857
Other alternative snacks
644
02,5005,0007,50010,00012,50015,00017,500
Add this content to your personal favorites. These can be accessed from the favorites menu in the main navigation.
You have no right to use this feature.
Make sure to contact us if you are interested in scientific citation.
You can upgrade your account to enable this functionality for all statistics.
This feature is not available with your current account.Request access
Learn more about how Statista can support your business.
Convenience Store News. (June 30, 2023). Average per store sales of alternative snacks in convenience stores in the United States in 2022, by category (in U.S. dollars) [Graph]. In Statista. Retrieved June 26, 2025, from https://www.statista.com/statistics/1016465/c-store-per-store-alternative-snack-sales-by-category/
Convenience Store News. "Average per store sales of alternative snacks in convenience stores in the United States in 2022, by category (in U.S. dollars)." Chart. June 30, 2023. Statista. Accessed June 26, 2025. https://www.statista.com/statistics/1016465/c-store-per-store-alternative-snack-sales-by-category/
Convenience Store News. (2023). Average per store sales of alternative snacks in convenience stores in the United States in 2022, by category (in U.S. dollars). Statista. Statista Inc.. Accessed: June 26, 2025. https://www.statista.com/statistics/1016465/c-store-per-store-alternative-snack-sales-by-category/
Convenience Store News. "Average per Store Sales of Alternative Snacks in Convenience Stores in The United States in 2022, by Category (in U.S. Dollars)." Statista, Statista Inc., 30 Jun 2023, https://www.statista.com/statistics/1016465/c-store-per-store-alternative-snack-sales-by-category/
Convenience Store News, Average per store sales of alternative snacks in convenience stores in the United States in 2022, by category (in U.S. dollars) Statista, https://www.statista.com/statistics/1016465/c-store-per-store-alternative-snack-sales-by-category/ (last visited June 26, 2025)
Average per store sales of alternative snacks in convenience stores in the United States in 2022, by category (in U.S. dollars) [Graph], Convenience Store News, June 30, 2023. [Online]. Available: https://www.statista.com/statistics/1016465/c-store-per-store-alternative-snack-sales-by-category/
Advertisement
Profit from additional features with an Employee Account
Please create an employee account to be able to mark statistics as favorites.
Then you can access your favorite statistics via the star in the header.
Profit from the additional features of your individual account
Currently, you are using a shared account. To use individual functions (e.g., mark statistics as favourites, set
statistic alerts) please log in with your personal account.
If you are an admin, please authenticate by logging in again.