

Advertisement
Advertisement
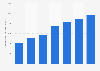
Consumption of antihypertensives per 1,000 inhabitants per day* in Luxembourg from 2010 to 2022
Loading statistic...

* For commercial use only
Basic Account
For single users
$0 USD
Always free
Access limited to Free Statistics. Premium Statistics are not included.
- Free Statistics
Based on your interests
Starter Account
For single users
$199 USD
per month, billed annually
1
- Free Statistics
- Premium Statistics
Professional Account
For teams of up to 5 people
$1,299 USD
per month, billed annually
1
- Free + Premium Statistics
- Reports
- Market Insights
1 All prices do not include sales tax. The account requires an annual contract and will renew after one year to the regular list price.
Other statistics that may interest you Statistics on
About the industry
10
- Basic Statistic Antihypertensive pharmaceutical daily consumption in Belgium 2010-2021
- Basic Statistic Antihypertensive pharmaceutical consumption in Czechia 2010-2021
- Basic Statistic Antihypertensive pharmaceutical consumption in Estonia 2010-2022
- Basic Statistic Antihypertensive pharmaceutical consumption in Germany 2010-2021
- Basic Statistic Antihypertensive pharmaceutical consumption in Hungary 2010-2023
- Basic Statistic Antihypertensive pharmaceutical consumption in Slovenia 2006-2017
- Premium Statistic Antihypertensive pharmaceutical consumption in the United Kingdom 2007-2017
- Premium Statistic Antihypertensive pharmaceutical consumption in Austria 2010-2017
- Premium Statistic Antihypertensive pharmaceutical consumption in the Netherlands 2005-2017
- Basic Statistic Antihypertensive pharmaceutical consumption in Portugal 2005-2018
About the region
8
- Basic Statistic Cardiovascular system pharmaceutical consumption in Luxembourg 2010-2022
- Basic Statistic Antidepressants pharmaceutical consumption in Luxembourg 2010-2022
- Basic Statistic Diabetes pharmaceutical consumption in Luxembourg 2010-2022
- Basic Statistic Value of pharmaceutical sales in Luxembourg 2010-2022
- Basic Statistic Antibacterials for systemic use: consumption in Luxembourg 2023
- Premium Statistic Revenue share of medication error reporting market in the Benelux 2018, by type
- Premium Statistic Revenue share of medication error reporting market in the Benelux 2018, by occurrence
- Premium Statistic Deaths in Luxembourg in 2014, by cause
Selected statistics
5
- Basic Statistic Expenditure worldwide on diabetes by market 2013-2018
- Premium Statistic Medicinal market growth worldwide including rebates 2009-2018
- Basic Statistic AstraZeneca revenue from product Pulmicort 2006-2024
- Premium Statistic Chinese insulin market distribution: leading companies 2011
- Premium Statistic U.S. insulin market distribution: leading companies 2011
Other regions
10
- Basic Statistic Antihypertensive pharmaceutical consumption in Slovakia 2005-2017
- Basic Statistic Cardiovascular system pharmaceutical consumption in Germany 2010-2021
- Premium Statistic Cardiovascular system daily pharmaceutical consumption in Denmark 2007-2017
- Premium Statistic Cardiovascular system pharmaceutical consumption in Austria 2010-2017
- Basic Statistic Cardiovascular system pharmaceutical consumption in Norway 2010-2022
- Basic Statistic Cardiovascular system drugs consumption in Spain 2010-2022
- Basic Statistic Cardiovascular system pharmaceutical consumption in Hungary 2010-2023
- Basic Statistic Cardiovascular system pharmaceutical consumption in Netherlands 2010-2021
- Basic Statistic Cardiovascular system pharmaceutical consumption in Finland 2010-2021
- Basic Statistic Cardiovascular system pharmaceutical consumption in the United Kingdom (UK) 2011-2021
Related statistics
10
- Basic Statistic Cardiovascular system pharmaceutical consumption in Portugal 2010-2022
- Basic Statistic Cardiovascular system pharmaceutical consumption in Slovakia 2010-2021
- Basic Statistic Cardiovascular system pharmaceutical consumption in Slovenia 2011-2022
- Basic Statistic Cardiovascular system pharmaceutical consumption in Belgium 2010-2021
- Basic Statistic Cardiovascular system pharmaceutical consumption in Czechia 2010-2021
- Basic Statistic Cardiovascular system pharmaceutical consumption in Estonia 2010-2022
- Basic Statistic Projected top pharmaceutical companies based on sales 2023
- Basic Statistic Projected top pharmaceutical companies based on new sales 2023
- Basic Statistic Diabetes pharmaceutical consumption in Iceland 2010-2022
- Basic Statistic Diabetes pharmaceutical consumption per day in Belgium 2005-2021
Further related statistics
10
- Sanofi total assets 2019 to 2023
- Pfizer revenues in the U.S. and abroad 2009-2024
- Merck & Co. R&D expenditure 2006-2024
- Pfizer ad spending 2006-2024
- R&D expenditure of AstraZeneca 2006-2024
- Johnson & Johnson employees 2004-2024
- Cvs Health total assets 2020 to 2024
- Walgreens gross profit and net earnings in the U.S. 2005-2024
- Annual revenue of Sinopharm 2010-2024
- Number of employees at Sinopharm 2011-2022
Further Content: You might find this interesting as well
Statistics
- Sanofi total assets 2019 to 2023
- Pfizer revenues in the U.S. and abroad 2009-2024
- Merck & Co. R&D expenditure 2006-2024
- Pfizer ad spending 2006-2024
- R&D expenditure of AstraZeneca 2006-2024
- Johnson & Johnson employees 2004-2024
- Cvs Health total assets 2020 to 2024
- Walgreens gross profit and net earnings in the U.S. 2005-2024
- Annual revenue of Sinopharm 2010-2024
- Number of employees at Sinopharm 2011-2022


* For commercial use only
Basic Account
For single users
$0 USD
Always free
Access limited to Free Statistics. Premium Statistics are not included.
- Free Statistics
Based on your interests
Starter Account
For single users
$199 USD
per month, billed annually
1
- Free Statistics
- Premium Statistics
Professional Account
For teams of up to 5 people
$1,299 USD
per month, billed annually
1
- Free + Premium Statistics
- Reports
- Market Insights
1 All prices do not include sales tax. The account requires an annual contract and will renew after one year to the regular list price.
OECD. (December 8, 2023). Consumption of antihypertensives per 1,000 inhabitants per day* in Luxembourg from 2010 to 2022 [Graph]. In Statista. Retrieved July 01, 2025, from https://www.statista.com/statistics/1019908/antihypertensive-pharmaceutical-consumption-in-luxembourg/
OECD. "Consumption of antihypertensives per 1,000 inhabitants per day* in Luxembourg from 2010 to 2022." Chart. December 8, 2023. Statista. Accessed July 01, 2025. https://www.statista.com/statistics/1019908/antihypertensive-pharmaceutical-consumption-in-luxembourg/
OECD. (2023). Consumption of antihypertensives per 1,000 inhabitants per day* in Luxembourg from 2010 to 2022. Statista. Statista Inc.. Accessed: July 01, 2025. https://www.statista.com/statistics/1019908/antihypertensive-pharmaceutical-consumption-in-luxembourg/
OECD. "Consumption of Antihypertensives per 1,000 Inhabitants per Day* in Luxembourg from 2010 to 2022." Statista, Statista Inc., 8 Dec 2023, https://www.statista.com/statistics/1019908/antihypertensive-pharmaceutical-consumption-in-luxembourg/
OECD, Consumption of antihypertensives per 1,000 inhabitants per day* in Luxembourg from 2010 to 2022 Statista, https://www.statista.com/statistics/1019908/antihypertensive-pharmaceutical-consumption-in-luxembourg/ (last visited July 01, 2025)
Consumption of antihypertensives per 1,000 inhabitants per day* in Luxembourg from 2010 to 2022 [Graph], OECD, December 8, 2023. [Online]. Available: https://www.statista.com/statistics/1019908/antihypertensive-pharmaceutical-consumption-in-luxembourg/
Advertisement