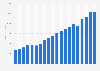
In 2023, net sales of Big 5 Sporting Goods stood at approximately 885 million U.S. dollars in the United States, a noticeable decrease from last year's numbers. Sales were at their highest in 2021, when the company generated a net revenue of more than 1.16 billion U.S. dollars.
Advertisement
Advertisement
Net sales of Big 5 Sporting Goods in the United States from 2017 to 2023
(in million U.S. dollars)
Profit from the additional features of your individual account
Currently, you are using a shared account. To use individual functions (e.g., mark statistics as favourites, set
statistic alerts) please log in with your personal account.
If you are an admin, please authenticate by logging in again.
Learn more about how Statista can support your business.
Big 5 Sporting Goods. (March 1, 2024). Net sales of Big 5 Sporting Goods in the United States from 2017 to 2023 (in million U.S. dollars) [Graph]. In Statista. Retrieved June 23, 2025, from https://www.statista.com/statistics/1020171/net-sales-of-big-5-sporting-goods-us/
Big 5 Sporting Goods. "Net sales of Big 5 Sporting Goods in the United States from 2017 to 2023 (in million U.S. dollars)." Chart. March 1, 2024. Statista. Accessed June 23, 2025. https://www.statista.com/statistics/1020171/net-sales-of-big-5-sporting-goods-us/
Big 5 Sporting Goods. (2024). Net sales of Big 5 Sporting Goods in the United States from 2017 to 2023 (in million U.S. dollars). Statista. Statista Inc.. Accessed: June 23, 2025. https://www.statista.com/statistics/1020171/net-sales-of-big-5-sporting-goods-us/
Big 5 Sporting Goods. "Net Sales of Big 5 Sporting Goods in The United States from 2017 to 2023 (in Million U.S. Dollars)." Statista, Statista Inc., 1 Mar 2024, https://www.statista.com/statistics/1020171/net-sales-of-big-5-sporting-goods-us/
Big 5 Sporting Goods, Net sales of Big 5 Sporting Goods in the United States from 2017 to 2023 (in million U.S. dollars) Statista, https://www.statista.com/statistics/1020171/net-sales-of-big-5-sporting-goods-us/ (last visited June 23, 2025)
Net sales of Big 5 Sporting Goods in the United States from 2017 to 2023 (in million U.S. dollars) [Graph], Big 5 Sporting Goods, March 1, 2024. [Online]. Available: https://www.statista.com/statistics/1020171/net-sales-of-big-5-sporting-goods-us/