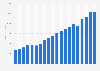
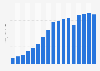
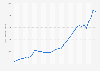
This statistic depicts the dollar sales share of Big 5 Sporting Goods in the United States, by product category. In the fiscal year of 2023, Big 5 Sporting Goods' hard goods category sales amounted to some 475 million U.S. dollars.
Advertisement
Advertisement
Dollar sales share of Big 5 Sporting Goods in the United States in 2023, by product category
(in million U.S. dollars)
Profit from the additional features of your individual account
Currently, you are using a shared account. To use individual functions (e.g., mark statistics as favourites, set
statistic alerts) please log in with your personal account.
If you are an admin, please authenticate by logging in again.
Learn more about how Statista can support your business.
Big 5 Sporting Goods. (March 1, 2024). Dollar sales share of Big 5 Sporting Goods in the United States in 2023, by product category (in million U.S. dollars) [Graph]. In Statista. Retrieved June 23, 2025, from https://www.statista.com/statistics/1020848/net-sales-share-of-big-5-sporting-goods-by-category-us/
Big 5 Sporting Goods. "Dollar sales share of Big 5 Sporting Goods in the United States in 2023, by product category (in million U.S. dollars)." Chart. March 1, 2024. Statista. Accessed June 23, 2025. https://www.statista.com/statistics/1020848/net-sales-share-of-big-5-sporting-goods-by-category-us/
Big 5 Sporting Goods. (2024). Dollar sales share of Big 5 Sporting Goods in the United States in 2023, by product category (in million U.S. dollars). Statista. Statista Inc.. Accessed: June 23, 2025. https://www.statista.com/statistics/1020848/net-sales-share-of-big-5-sporting-goods-by-category-us/
Big 5 Sporting Goods. "Dollar Sales Share of Big 5 Sporting Goods in The United States in 2023, by Product Category (in Million U.S. Dollars)." Statista, Statista Inc., 1 Mar 2024, https://www.statista.com/statistics/1020848/net-sales-share-of-big-5-sporting-goods-by-category-us/
Big 5 Sporting Goods, Dollar sales share of Big 5 Sporting Goods in the United States in 2023, by product category (in million U.S. dollars) Statista, https://www.statista.com/statistics/1020848/net-sales-share-of-big-5-sporting-goods-by-category-us/ (last visited June 23, 2025)
Dollar sales share of Big 5 Sporting Goods in the United States in 2023, by product category (in million U.S. dollars) [Graph], Big 5 Sporting Goods, March 1, 2024. [Online]. Available: https://www.statista.com/statistics/1020848/net-sales-share-of-big-5-sporting-goods-by-category-us/