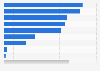
This statistic illustrates the average time spent on mobile game apps per session in Indonesia as of August 2018. During the period surveyed, it was found that male mobile gamers in Indonesia spent an average of 56 minutes per session, while female mobile gamers spent an average of 50 minutes each time they opened the mobile game apps.
Average time spent on mobile game app per session in Indonesia as of August 2018, by gender
(in minutes)
Average usage time per session in minutes
Male
Female
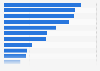
<30
32%
38%
30-60
34%
32%
60-90
20%
20%
90+
14%
10%
0%10%20%30%40%50%
Add this content to your personal favorites. These can be accessed from the favorites menu in the main navigation.
You have no right to use this feature.
Make sure to contact us if you are interested in scientific citation.
You can upgrade your account to enable this functionality for all statistics.
This feature is not available with your current account.Request access
Learn more about how Statista can support your business.
Decision Lab. (August 31, 2018). Average time spent on mobile game app per session in Indonesia as of August 2018, by gender (in minutes) [Graph]. In Statista. Retrieved June 07, 2025, from https://www.statista.com/statistics/1021627/indonesia-mobile-game-app-usage-per-each-session-by-gender/
Decision Lab. "Average time spent on mobile game app per session in Indonesia as of August 2018, by gender (in minutes) ." Chart. August 31, 2018. Statista. Accessed June 07, 2025. https://www.statista.com/statistics/1021627/indonesia-mobile-game-app-usage-per-each-session-by-gender/
Decision Lab. (2018). Average time spent on mobile game app per session in Indonesia as of August 2018, by gender (in minutes) . Statista. Statista Inc.. Accessed: June 07, 2025. https://www.statista.com/statistics/1021627/indonesia-mobile-game-app-usage-per-each-session-by-gender/
Decision Lab. "Average Time Spent on Mobile Game App per Session in Indonesia as of August 2018, by Gender (in Minutes) ." Statista, Statista Inc., 31 Aug 2018, https://www.statista.com/statistics/1021627/indonesia-mobile-game-app-usage-per-each-session-by-gender/
Decision Lab, Average time spent on mobile game app per session in Indonesia as of August 2018, by gender (in minutes) Statista, https://www.statista.com/statistics/1021627/indonesia-mobile-game-app-usage-per-each-session-by-gender/ (last visited June 07, 2025)
Average time spent on mobile game app per session in Indonesia as of August 2018, by gender (in minutes) [Graph], Decision Lab, August 31, 2018. [Online]. Available: https://www.statista.com/statistics/1021627/indonesia-mobile-game-app-usage-per-each-session-by-gender/
Profit from additional features with an Employee Account
Please create an employee account to be able to mark statistics as favorites.
Then you can access your favorite statistics via the star in the header.
Profit from the additional features of your individual account
Currently, you are using a shared account. To use individual functions (e.g., mark statistics as favourites, set
statistic alerts) please log in with your personal account.
If you are an admin, please authenticate by logging in again.