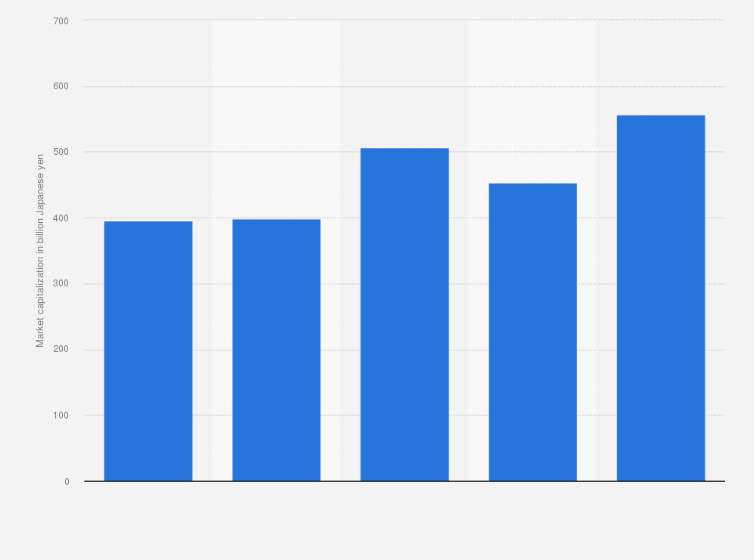
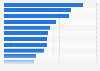
This statistic depicts the market capitalization of Alfresa Holdings Corporation from fiscal year 2013 to 2017. In fiscal 2017, the Japanese pharmaceutical company's market cap was valued at approximately 556.5 billion Japanese yen, an increase from around 395.4 billion yen in fiscal year 2013.
Market capitalization of Alfresa Holdings Corporation from fiscal year 2013 to 2017
(in billion Japanese yen)
Adjust the presentation of the statistic and data points.
Share the statistic on social media channels or embed the statistic in your
website using "Embed Code", where available.
Cite this statistic and select one of the following formats: APA, Chicago, Harvard, MLA & Bluebook.
Print the statistic including description and metadata.
Chart type
Market capitalization of Alfresa Holdings Corporation from fiscal year 2013 to 2017
Share this statistic
You have no right to use this feature.
Make sure to contact us if you are interested in scientific citation.
You can upgrade your account to enable this functionality for all statistics.
This feature is not available with your current account.Request access
fiscal years 2013 to 2017; the company's fiscal year starts April 1 of each stated year and ends March 31 of the following year
Special properties
consolidated figures
Supplementary notes
According to the source, figures are calculated by multiplying 'number of issued shares at the end of the year (including treasury stock)' by 'closing price at the end of the year'. 100 Japanese yen equal 0.74 U.S. dollars or 0.70 euros as of December 2022.
Learn more about how Statista can support your business.
Alfresa Pharma. (October 31, 2018). Market capitalization of Alfresa Holdings Corporation from fiscal year 2013 to 2017 (in billion Japanese yen) [Graph]. In Statista. Retrieved May 13, 2025, from https://www.statista.com/statistics/1022217/alfresa-market-capitalization/
Alfresa Pharma. "Market capitalization of Alfresa Holdings Corporation from fiscal year 2013 to 2017 (in billion Japanese yen)." Chart. October 31, 2018. Statista. Accessed May 13, 2025. https://www.statista.com/statistics/1022217/alfresa-market-capitalization/
Alfresa Pharma. (2018). Market capitalization of Alfresa Holdings Corporation from fiscal year 2013 to 2017 (in billion Japanese yen). Statista. Statista Inc.. Accessed: May 13, 2025. https://www.statista.com/statistics/1022217/alfresa-market-capitalization/
Alfresa Pharma. "Market Capitalization of Alfresa Holdings Corporation from Fiscal Year 2013 to 2017 (in Billion Japanese Yen)." Statista, Statista Inc., 31 Oct 2018, https://www.statista.com/statistics/1022217/alfresa-market-capitalization/
Alfresa Pharma, Market capitalization of Alfresa Holdings Corporation from fiscal year 2013 to 2017 (in billion Japanese yen) Statista, https://www.statista.com/statistics/1022217/alfresa-market-capitalization/ (last visited May 13, 2025)
Market capitalization of Alfresa Holdings Corporation from fiscal year 2013 to 2017 (in billion Japanese yen) [Graph], Alfresa Pharma, October 31, 2018. [Online]. Available: https://www.statista.com/statistics/1022217/alfresa-market-capitalization/
Profit from additional features with an Employee Account
Please create an employee account to be able to mark statistics as favorites.
Then you can access your favorite statistics via the star in the header.
Profit from the additional features of your individual account
Currently, you are using a shared account. To use individual functions (e.g., mark statistics as favourites, set
statistic alerts) please log in with your personal account.
If you are an admin, please authenticate by logging in again.