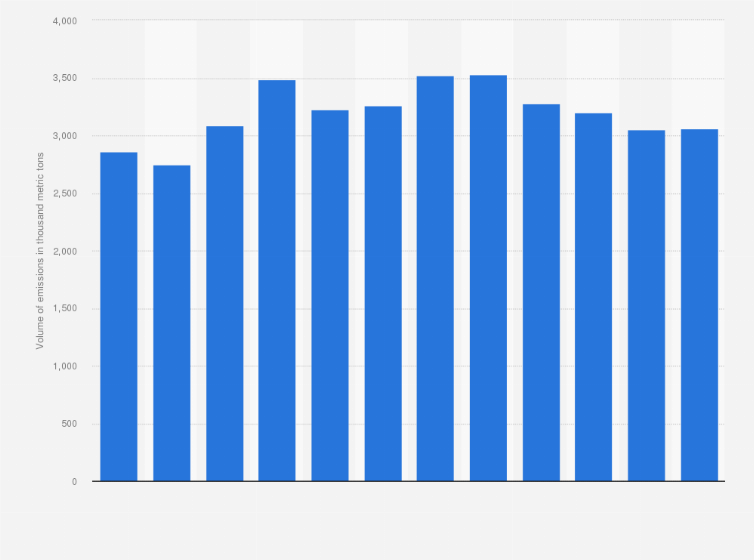
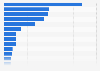
In 2022, the volume of carbon dioxide emissions from food, beverage, and tobacco manufacturing in New Zealand was around
*************
Log in or register to access precise data.
metric tons, indicating a slight decrease from the previous year. Moreover, the volume of carbon dioxide emissions from the manufacturing of these products in New Zealand was the highest in 2019, amounting to
Adjust the presentation of the statistic and data points.
Share the statistic on social media channels or embed the statistic in your
website using "Embed Code", where available.
Cite this statistic and select one of the following formats: APA, Chicago, Harvard, MLA & Bluebook.
Print the statistic including description and metadata.
Chart type
Volume of carbon dioxide emissions from food, beverage, and tobacco manufacturing in New Zealand from 2011 to 2022
Share this statistic
You have no right to use this feature.
Make sure to contact us if you are interested in scientific citation.
You can upgrade your account to enable this functionality for all statistics.
This feature is not available with your current account.Request access
Note: This work is based on/includes Stats NZ's data which are licensed by Stats NZ for re-use under the Creative Commons Attribution 4.0 International license.
Learn more about how Statista can support your business.
Statistics New Zealand. (May 30, 2024). Volume of carbon dioxide emissions from food, beverage, and tobacco manufacturing in New Zealand from 2011 to 2022 (in 1,000 metric tons) [Graph]. In Statista. Retrieved July 22, 2025, from https://www.statista.com/statistics/1023804/new-zealand-food-beverage-and-tobacco-manufacturing-co2-emission-volume/
Statistics New Zealand. "Volume of carbon dioxide emissions from food, beverage, and tobacco manufacturing in New Zealand from 2011 to 2022 (in 1,000 metric tons)." Chart. May 30, 2024. Statista. Accessed July 22, 2025. https://www.statista.com/statistics/1023804/new-zealand-food-beverage-and-tobacco-manufacturing-co2-emission-volume/
Statistics New Zealand. (2024). Volume of carbon dioxide emissions from food, beverage, and tobacco manufacturing in New Zealand from 2011 to 2022 (in 1,000 metric tons). Statista. Statista Inc.. Accessed: July 22, 2025. https://www.statista.com/statistics/1023804/new-zealand-food-beverage-and-tobacco-manufacturing-co2-emission-volume/
Statistics New Zealand. "Volume of Carbon Dioxide Emissions from Food, Beverage, and Tobacco Manufacturing in New Zealand from 2011 to 2022 (in 1,000 Metric Tons)." Statista, Statista Inc., 30 May 2024, https://www.statista.com/statistics/1023804/new-zealand-food-beverage-and-tobacco-manufacturing-co2-emission-volume/
Statistics New Zealand, Volume of carbon dioxide emissions from food, beverage, and tobacco manufacturing in New Zealand from 2011 to 2022 (in 1,000 metric tons) Statista, https://www.statista.com/statistics/1023804/new-zealand-food-beverage-and-tobacco-manufacturing-co2-emission-volume/ (last visited July 22, 2025)
Volume of carbon dioxide emissions from food, beverage, and tobacco manufacturing in New Zealand from 2011 to 2022 (in 1,000 metric tons) [Graph], Statistics New Zealand, May 30, 2024. [Online]. Available: https://www.statista.com/statistics/1023804/new-zealand-food-beverage-and-tobacco-manufacturing-co2-emission-volume/
Advertisement
Profit from additional features with an Employee Account
Please create an employee account to be able to mark statistics as favorites.
Then you can access your favorite statistics via the star in the header.
Profit from the additional features of your individual account
Currently, you are using a shared account. To use individual functions (e.g., mark statistics as favourites, set
statistic alerts) please log in with your personal account.
If you are an admin, please authenticate by logging in again.