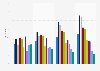
The statistic depicts the participation rate in selected physical activities in the United States in 2021, by age group. During the survey, 70 percent of Millennial respondents stated that they participated in fitness sports in 2021.
Advertisement
Advertisement
Participation rate in selected physical activities in the United States in 2021, by age group
Profit from the additional features of your individual account
Currently, you are using a shared account. To use individual functions (e.g., mark statistics as favourites, set
statistic alerts) please log in with your personal account.
If you are an admin, please authenticate by logging in again.
Learn more about how Statista can support your business.
Physical Activity Council. (July 13, 2022). Participation rate in selected physical activities in the United States in 2021, by age group [Graph]. In Statista. Retrieved June 30, 2025, from https://www.statista.com/statistics/1023923/physical-activity-participation-rate-type-age/
Physical Activity Council. "Participation rate in selected physical activities in the United States in 2021, by age group." Chart. July 13, 2022. Statista. Accessed June 30, 2025. https://www.statista.com/statistics/1023923/physical-activity-participation-rate-type-age/
Physical Activity Council. (2022). Participation rate in selected physical activities in the United States in 2021, by age group. Statista. Statista Inc.. Accessed: June 30, 2025. https://www.statista.com/statistics/1023923/physical-activity-participation-rate-type-age/
Physical Activity Council. "Participation Rate in Selected Physical Activities in The United States in 2021, by Age Group." Statista, Statista Inc., 13 Jul 2022, https://www.statista.com/statistics/1023923/physical-activity-participation-rate-type-age/
Physical Activity Council, Participation rate in selected physical activities in the United States in 2021, by age group Statista, https://www.statista.com/statistics/1023923/physical-activity-participation-rate-type-age/ (last visited June 30, 2025)
Participation rate in selected physical activities in the United States in 2021, by age group [Graph], Physical Activity Council, July 13, 2022. [Online]. Available: https://www.statista.com/statistics/1023923/physical-activity-participation-rate-type-age/