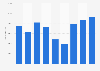
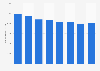
From 2017 to 2018, the number of Italian Volleyball Federation's indoor societies slightly increased, passing from 4,390 to 4,414. Although Lombardy experienced a slight decrease over the period considered, for both years it remained the region with the highest number of societies. Its 835 societies recorded in 2018 were about the 19 percent of the total figure. Moreover, Lazio was a region that recorded a significant increase. According to the study, ten new societies registered to the Italian Volleyball Federation in 2018.
Advertisement
Advertisement
Number of indoor societies in the Italian Volleyball Federation in 2017 and 2018, by region
You have no right to use this feature.
Make sure to contact us if you are interested in scientific citation.
You can upgrade your account to enable this functionality for all statistics.
This feature is not available with your current account.Request access
Learn more about how Statista can support your business.
Federazione Italiana Pallavolo. (March 11, 2019). Number of indoor societies in the Italian Volleyball Federation in 2017 and 2018, by region [Graph]. In Statista. Retrieved July 15, 2025, from https://www.statista.com/statistics/1032733/number-of-indoor-societies-of-the-italian-volleyball-federation-by-region/
Federazione Italiana Pallavolo. "Number of indoor societies in the Italian Volleyball Federation in 2017 and 2018, by region ." Chart. March 11, 2019. Statista. Accessed July 15, 2025. https://www.statista.com/statistics/1032733/number-of-indoor-societies-of-the-italian-volleyball-federation-by-region/
Federazione Italiana Pallavolo. (2019). Number of indoor societies in the Italian Volleyball Federation in 2017 and 2018, by region . Statista. Statista Inc.. Accessed: July 15, 2025. https://www.statista.com/statistics/1032733/number-of-indoor-societies-of-the-italian-volleyball-federation-by-region/
Federazione Italiana Pallavolo. "Number of Indoor Societies in The Italian Volleyball Federation in 2017 and 2018, by Region ." Statista, Statista Inc., 11 Mar 2019, https://www.statista.com/statistics/1032733/number-of-indoor-societies-of-the-italian-volleyball-federation-by-region/
Federazione Italiana Pallavolo, Number of indoor societies in the Italian Volleyball Federation in 2017 and 2018, by region Statista, https://www.statista.com/statistics/1032733/number-of-indoor-societies-of-the-italian-volleyball-federation-by-region/ (last visited July 15, 2025)
Number of indoor societies in the Italian Volleyball Federation in 2017 and 2018, by region [Graph], Federazione Italiana Pallavolo, March 11, 2019. [Online]. Available: https://www.statista.com/statistics/1032733/number-of-indoor-societies-of-the-italian-volleyball-federation-by-region/
Advertisement
Profit from additional features with an Employee Account
Please create an employee account to be able to mark statistics as favorites.
Then you can access your favorite statistics via the star in the header.
Profit from the additional features of your individual account
Currently, you are using a shared account. To use individual functions (e.g., mark statistics as favourites, set
statistic alerts) please log in with your personal account.
If you are an admin, please authenticate by logging in again.