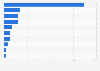
In 2023, green tea accounted for around 57.9 percent of the total tea production volume in China. Black tea was the second most produced tea type in China with approximately 15.2 percent output share.
Advertisement
Advertisement
Share of tea production volume in China in 2023, by type
Profit from the additional features of your individual account
Currently, you are using a shared account. To use individual functions (e.g., mark statistics as favourites, set
statistic alerts) please log in with your personal account.
If you are an admin, please authenticate by logging in again.
Learn more about how Statista can support your business.
Sohu. (April 16, 2024). Share of tea production volume in China in 2023, by type [Graph]. In Statista. Retrieved June 20, 2025, from https://www.statista.com/statistics/1033701/china-tea-production-volume-share-by-type/
Sohu. "Share of tea production volume in China in 2023, by type." Chart. April 16, 2024. Statista. Accessed June 20, 2025. https://www.statista.com/statistics/1033701/china-tea-production-volume-share-by-type/
Sohu. (2024). Share of tea production volume in China in 2023, by type. Statista. Statista Inc.. Accessed: June 20, 2025. https://www.statista.com/statistics/1033701/china-tea-production-volume-share-by-type/
Sohu. "Share of Tea Production Volume in China in 2023, by Type." Statista, Statista Inc., 16 Apr 2024, https://www.statista.com/statistics/1033701/china-tea-production-volume-share-by-type/
Sohu, Share of tea production volume in China in 2023, by type Statista, https://www.statista.com/statistics/1033701/china-tea-production-volume-share-by-type/ (last visited June 20, 2025)
Share of tea production volume in China in 2023, by type [Graph], Sohu, April 16, 2024. [Online]. Available: https://www.statista.com/statistics/1033701/china-tea-production-volume-share-by-type/