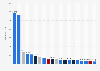
The total fertility rate of the world has dropped from around five children per woman in 1950, to 2.2 children per woman in 2025, which means that women today are having fewer than half the number of children that women did 75 years ago.
Replacement level fertility
This change has come as a result of the global demographic transition, and is influenced by factors such as the significant reduction in infant and child mortality, reduced number of child marriages, increased educational and vocational opportunities for women, and the increased efficacy and availability of contraception. While this change has become synonymous with societal progress, it does have wide-reaching demographic impact - if the global average falls below replacement level (roughly 2.1 children per woman), as is expected to happen in the 2050s, then this will lead to long-term population decline on a global scale.
Regional variations
When broken down by continent, Africa is the only region with a fertility rate above the global average, and, alongside Oceania, it is the only region with a fertility rate above replacement level. Until the 1980s, the average woman in Africa could expect to have 6-7 children over the course of their lifetime, and there are still several countries in Africa where women can still expect to have five or more children in 2025. Historically, Europe has had the lowest fertility rates in the world over the past century, falling below replacement level in 1975. Europe's population has grown through a combination of migration and increasing life expectancy, however even high immigration rates could not prevent its population from going into decline in 2021.
Advertisement
Advertisement
Annual total fertility rate in each continent and worldwide from 1950 to 2023, with projections until 2050
Characteristic
World
Africa
Asia
Europe
Latin America and Caribbean
Northern America
Oceania
2050
2.1
2.79
1.82
1.5
1.69
1.62
1.93
2049
2.1
2.82
1.82
1.5
1.69
1.62
1.94
2048
2.11
2.85
1.82
1.5
1.69
1.62
1.94
2047
2.11
2.89
1.82
1.5
1.69
1.62
1.95
2046
2.11
2.92
1.82
1.49
1.69
1.62
1.96
2045
2.12
2.95
1.81
1.49
1.69
1.62
1.97
2044
2.12
2.99
1.81
1.49
1.7
1.61
1.97
2043
2.12
3.03
1.8
1.49
1.7
1.61
1.98
2042
2.12
3.07
1.8
1.48
1.7
1.61
1.99
2041
2.12
3.11
1.8
1.48
1.7
1.61
1.99
2040
2.13
3.15
1.8
1.48
1.71
1.61
2
2039
2.13
3.19
1.8
1.48
1.71
1.61
2.01
2038
2.13
3.23
1.8
1.48
1.71
1.61
2.01
2037
2.14
3.28
1.8
1.47
1.71
1.61
2.02
2036
2.15
3.33
1.81
1.47
1.72
1.61
2.03
2035
2.15
3.38
1.81
1.47
1.72
1.6
2.03
2034
2.16
3.43
1.82
1.46
1.72
1.6
2.04
2033
2.17
3.48
1.82
1.46
1.73
1.6
2.05
2032
2.18
3.54
1.83
1.45
1.73
1.6
2.06
2031
2.19
3.6
1.84
1.45
1.74
1.6
2.06
2030
2.2
3.65
1.84
1.44
1.74
1.6
2.07
2029
2.2
3.71
1.85
1.43
1.75
1.6
2.08
2028
2.21
3.77
1.86
1.43
1.75
1.6
2.1
2027
2.22
3.83
1.86
1.42
1.76
1.59
2.11
2026
2.23
3.89
1.87
1.41
1.77
1.6
2.12
2025
2.24
3.95
1.87
1.41
1.78
1.59
2.13
2024*
2.25
4.02
1.88
1.4
1.8
1.59
2.14
2023
2.25
4.07
1.88
1.4
1.81
1.6
2.14
2022
2.27
4.13
1.9
1.41
1.82
1.64
2.16
2021
2.29
4.18
1.93
1.47
1.85
1.61
2.17
2020
2.32
4.24
1.97
1.47
1.87
1.6
2.14
2019
2.4
4.31
2.08
1.49
1.93
1.66
2.2
2018
2.44
4.39
2.12
1.52
1.97
1.7
2.26
2017
2.5
4.48
2.21
1.56
1.99
1.73
2.28
2016
2.54
4.55
2.24
1.61
2.02
1.78
2.33
2015
2.54
4.63
2.23
1.61
2.07
1.81
2.36
2014
2.56
4.69
2.27
1.61
2.1
1.83
2.38
2013
2.57
4.74
2.28
1.59
2.11
1.82
2.44
2012
2.61
4.8
2.33
1.61
2.14
1.84
2.49
2011
2.59
4.84
2.3
1.59
2.16
1.86
2.49
2010
2.6
4.89
2.32
1.61
2.18
1.89
2.52
2009
2.62
4.93
2.35
1.6
2.21
1.96
2.54
2008
2.63
4.97
2.36
1.59
2.23
2.02
2.59
2007
2.62
4.99
2.37
1.54
2.26
2.05
2.58
2006
2.63
5.01
2.38
1.49
2.3
2.04
2.51
2005
2.63
5.04
2.4
1.46
2.34
1.99
2.49
2004
2.65
5.06
2.43
1.47
2.38
1.98
2.46
2003
2.66
5.08
2.45
1.44
2.42
1.98
2.44
2002
2.68
5.12
2.49
1.42
2.48
1.96
2.44
2001
2.71
5.16
2.53
1.4
2.54
1.96
2.43
2000
2.75
5.2
2.58
1.41
2.61
1.98
2.45
1999
2.75
5.25
2.58
1.4
2.67
1.95
2.44
1998
2.78
5.3
2.61
1.42
2.74
1.94
2.43
1997
2.81
5.35
2.65
1.43
2.79
1.92
2.44
1996
2.85
5.43
2.69
1.44
2.85
1.93
2.45
1995
2.89
5.51
2.75
1.45
2.92
1.94
2.46
1994
2.93
5.59
2.8
1.49
2.98
1.96
2.48
1993
2.98
5.66
2.86
1.52
3.04
1.98
2.5
1992
3.04
5.75
2.94
1.59
3.1
2.01
2.52
1991
3.13
5.83
3.05
1.66
3.17
2.03
2.51
1990
3.31
5.91
3.31
1.72
3.24
2.03
2.55
1989
3.35
6
3.36
1.76
3.32
1.98
2.51
1988
3.39
6.09
3.41
1.82
3.39
1.91
2.52
1987
3.48
6.17
3.54
1.84
3.48
1.85
2.52
1986
3.5
6.24
3.58
1.85
3.58
1.83
2.53
1985
3.52
6.32
3.59
1.83
3.67
1.83
2.55
1984
3.55
6.39
3.64
1.86
3.77
1.8
2.54
1983
3.58
6.46
3.67
1.88
3.86
1.8
2.58
1982
3.71
6.51
3.88
1.89
3.96
1.83
2.6
1981
3.71
6.55
3.87
1.89
4.05
1.83
2.62
1980
3.74
6.59
3.91
1.93
4.15
1.84
2.61
1979
3.77
6.62
3.95
1.94
4.25
1.83
2.64
1978
3.79
6.65
3.97
1.96
4.35
1.79
2.69
1977
3.85
6.66
4.06
1.99
4.45
1.82
2.76
1976
3.97
6.68
4.26
2.03
4.55
1.78
2.81
1975
4.08
6.69
4.43
2.07
4.64
1.81
2.93
1974
4.26
6.69
4.72
2.13
4.75
1.87
3.09
1973
4.42
6.69
4.98
2.14
4.87
1.91
3.21
1972
4.55
6.69
5.16
2.21
4.97
2.05
3.42
1971
4.68
6.69
5.35
2.27
5.07
2.3
3.6
1970
4.83
6.69
5.59
2.28
5.17
2.49
3.57
1969
4.87
6.69
5.65
2.33
5.27
2.49
3.61
1968
4.96
6.69
5.82
2.37
5.36
2.5
3.63
1967
4.85
6.69
5.6
2.42
5.47
2.6
3.62
1966
4.96
6.69
5.77
2.42
5.58
2.77
3.66
1965
5.07
6.68
5.95
2.44
5.68
2.99
3.74
1964
5.12
6.68
5.99
2.49
5.76
3.27
3.89
1963
5.31
6.68
6.31
2.52
5.82
3.41
4.04
1962
5.02
6.67
5.79
2.52
5.85
3.55
4.12
1961
4.57
6.66
4.95
2.57
5.86
3.7
4.2
1960
4.7
6.65
5.18
2.59
5.87
3.74
4.13
1959
4.74
6.63
5.27
2.6
5.87
3.76
4.1
1958
4.93
6.62
5.65
2.6
5.86
3.76
4.07
1957
5.07
6.61
5.91
2.61
5.85
3.71
4.05
1956
4.93
6.59
5.69
2.61
5.84
3.64
3.98
1955
5
6.58
5.85
2.62
5.83
3.53
3.92
1954
5
6.57
5.86
2.63
5.82
3.5
3.84
1953
4.92
6.56
5.76
2.62
5.81
3.38
3.82
1952
5
6.54
5.93
2.65
5.8
3.31
3.8
1951
4.82
6.53
5.61
2.66
5.8
3.21
3.7
1950
4.85
6.52
5.69
2.7
5.79
3.11
3.69
Zoomable Statistic: Select the range in the chart you want to zoom in on.
Profit from the additional features of your individual account
Currently, you are using a shared account. To use individual functions (e.g., mark statistics as favourites, set
statistic alerts) please log in with your personal account.
If you are an admin, please authenticate by logging in again.
Learn more about how Statista can support your business.
United Nations Department of Economic and Social Affairs (UN DESA). (July 11, 2024). Annual total fertility rate in each continent and worldwide from 1950 to 2023, with projections until 2050 [Graph]. In Statista. Retrieved June 26, 2025, from https://www.statista.com/statistics/1034075/fertility-rate-world-continents-1950-2020/
United Nations Department of Economic and Social Affairs (UN DESA). "Annual total fertility rate in each continent and worldwide from 1950 to 2023, with projections until 2050." Chart. July 11, 2024. Statista. Accessed June 26, 2025. https://www.statista.com/statistics/1034075/fertility-rate-world-continents-1950-2020/
United Nations Department of Economic and Social Affairs (UN DESA). (2024). Annual total fertility rate in each continent and worldwide from 1950 to 2023, with projections until 2050. Statista. Statista Inc.. Accessed: June 26, 2025. https://www.statista.com/statistics/1034075/fertility-rate-world-continents-1950-2020/
United Nations Department of Economic and Social Affairs (UN DESA). "Annual Total Fertility Rate in Each Continent and Worldwide from 1950 to 2023, with Projections until 2050." Statista, Statista Inc., 11 Jul 2024, https://www.statista.com/statistics/1034075/fertility-rate-world-continents-1950-2020/
United Nations Department of Economic and Social Affairs (UN DESA), Annual total fertility rate in each continent and worldwide from 1950 to 2023, with projections until 2050 Statista, https://www.statista.com/statistics/1034075/fertility-rate-world-continents-1950-2020/ (last visited June 26, 2025)
Annual total fertility rate in each continent and worldwide from 1950 to 2023, with projections until 2050 [Graph], United Nations Department of Economic and Social Affairs (UN DESA), July 11, 2024. [Online]. Available: https://www.statista.com/statistics/1034075/fertility-rate-world-continents-1950-2020/