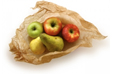
Sales of food products in the United States with vegan claims grew the most in 2019 compared to a year ago. Food products aimed at vegans grew by 1.7 percent compared to 0.5 percent growth for pescatarian products.
Profit from the additional features of your individual account
Currently, you are using a shared account. To use individual functions (e.g., mark statistics as favourites, set
statistic alerts) please log in with your personal account.
If you are an admin, please authenticate by logging in again.
Learn more about how Statista can support your business.
Nielsen. (July 26, 2019). Sales growth of food products in the United States in 2019, by lifestyle claim* [Graph]. In Statista. Retrieved June 20, 2025, from https://www.statista.com/statistics/1038605/food-product-sales-growth-by-lifestyle-us/
Nielsen. "Sales growth of food products in the United States in 2019, by lifestyle claim*." Chart. July 26, 2019. Statista. Accessed June 20, 2025. https://www.statista.com/statistics/1038605/food-product-sales-growth-by-lifestyle-us/
Nielsen. (2019). Sales growth of food products in the United States in 2019, by lifestyle claim*. Statista. Statista Inc.. Accessed: June 20, 2025. https://www.statista.com/statistics/1038605/food-product-sales-growth-by-lifestyle-us/
Nielsen. "Sales Growth of Food Products in The United States in 2019, by Lifestyle Claim*." Statista, Statista Inc., 26 Jul 2019, https://www.statista.com/statistics/1038605/food-product-sales-growth-by-lifestyle-us/
Nielsen, Sales growth of food products in the United States in 2019, by lifestyle claim* Statista, https://www.statista.com/statistics/1038605/food-product-sales-growth-by-lifestyle-us/ (last visited June 20, 2025)
Sales growth of food products in the United States in 2019, by lifestyle claim* [Graph], Nielsen, July 26, 2019. [Online]. Available: https://www.statista.com/statistics/1038605/food-product-sales-growth-by-lifestyle-us/