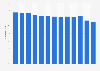
In 2022, the percentage of informal employment in Guatemala stood at 79 percent of the total employed population, the lowest rate since 2019. Still, this means that around eight of every ten workers in Guatemala were considered informally employed. The Central American country ranks as one of Latin American countries with highest levels of employment informality.
Advertisement
Advertisement
Informal employment as percentage of total employment in Guatemala from 2010 to 2022
According to the source's definition: "Employment in the informal sector refers all persons who, during a given reference period, were employed in at least one informal sector enterprise, irrespective of their status in employment and whether it was their main or a secondary job. An informal sector enterprise is (1) an unincorporated enterprise and (2) a market enterprise (i.e., it sells at least some of the goods or services it produces), and (3) meets at least one of the following criteria: (i) the enterprise is not registered, (ii) the employees of the enterprise are not registered, or (iii) the number of persons engaged on a continuous basis is below a threshold determined by the country."
The release date given is the last update date provided by the source.
The source does not provide data for 2020.
Profit from the additional features of your individual account
Currently, you are using a shared account. To use individual functions (e.g., mark statistics as favourites, set
statistic alerts) please log in with your personal account.
If you are an admin, please authenticate by logging in again.
Learn more about how Statista can support your business.
ILO. (June 7, 2024). Informal employment as percentage of total employment in Guatemala from 2010 to 2022 [Graph]. In Statista. Retrieved June 28, 2025, from https://www.statista.com/statistics/1039957/informal-employment-share-guatemala/
ILO. "Informal employment as percentage of total employment in Guatemala from 2010 to 2022." Chart. June 7, 2024. Statista. Accessed June 28, 2025. https://www.statista.com/statistics/1039957/informal-employment-share-guatemala/
ILO. (2024). Informal employment as percentage of total employment in Guatemala from 2010 to 2022. Statista. Statista Inc.. Accessed: June 28, 2025. https://www.statista.com/statistics/1039957/informal-employment-share-guatemala/
ILO. "Informal Employment as Percentage of Total Employment in Guatemala from 2010 to 2022." Statista, Statista Inc., 7 Jun 2024, https://www.statista.com/statistics/1039957/informal-employment-share-guatemala/
ILO, Informal employment as percentage of total employment in Guatemala from 2010 to 2022 Statista, https://www.statista.com/statistics/1039957/informal-employment-share-guatemala/ (last visited June 28, 2025)
Informal employment as percentage of total employment in Guatemala from 2010 to 2022 [Graph], ILO, June 7, 2024. [Online]. Available: https://www.statista.com/statistics/1039957/informal-employment-share-guatemala/