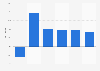
The non-food FMCG segment yielded the highest revenue with 35 percent of the total sales of the hypermarket stores across India during 2016, closely followed by food and grocery products with 32 percent of the total sales.
Share of hypermarket sales across India during 2016, by category
Profit from the additional features of your individual account
Currently, you are using a shared account. To use individual functions (e.g., mark statistics as favourites, set
statistic alerts) please log in with your personal account.
If you are an admin, please authenticate by logging in again.
Learn more about how Statista can support your business.
Motilal Oswal Group. (April 9, 2019). Share of hypermarket sales across India during 2016, by category [Graph]. In Statista. Retrieved May 09, 2025, from https://www.statista.com/statistics/1044503/india-hypermarket-sales-share-by-category/
Motilal Oswal Group. "Share of hypermarket sales across India during 2016, by category." Chart. April 9, 2019. Statista. Accessed May 09, 2025. https://www.statista.com/statistics/1044503/india-hypermarket-sales-share-by-category/
Motilal Oswal Group. (2019). Share of hypermarket sales across India during 2016, by category. Statista. Statista Inc.. Accessed: May 09, 2025. https://www.statista.com/statistics/1044503/india-hypermarket-sales-share-by-category/
Motilal Oswal Group. "Share of Hypermarket Sales across India during 2016, by Category." Statista, Statista Inc., 9 Apr 2019, https://www.statista.com/statistics/1044503/india-hypermarket-sales-share-by-category/
Motilal Oswal Group, Share of hypermarket sales across India during 2016, by category Statista, https://www.statista.com/statistics/1044503/india-hypermarket-sales-share-by-category/ (last visited May 09, 2025)
Share of hypermarket sales across India during 2016, by category [Graph], Motilal Oswal Group, April 9, 2019. [Online]. Available: https://www.statista.com/statistics/1044503/india-hypermarket-sales-share-by-category/