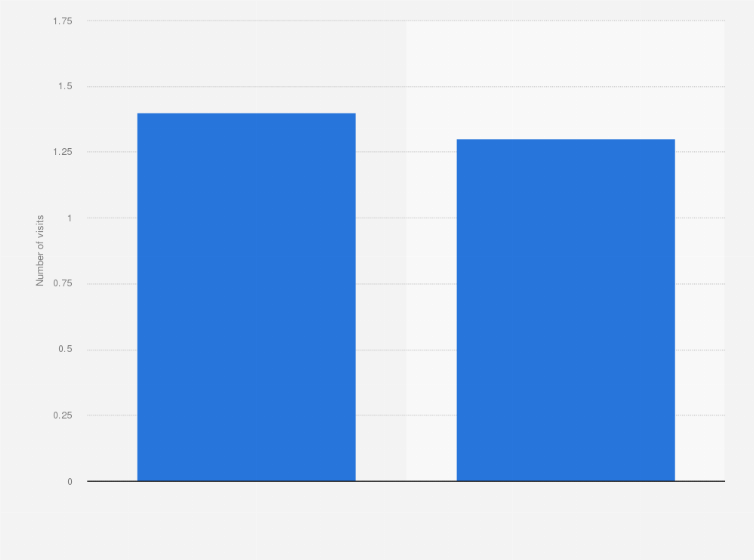
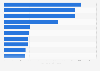
According to a survey conducted in South Korea in 2024, male respondents stated that they had visited the cinema approximately 1.4 times on average to watch animations. Female respondents reported an average of 1.3 visits, which was also the overall average number of visits that year.
Average number of cinema visits to watch animation within the previous year in South Korea as of June 2024, by gender
Adjust the presentation of the statistic and data points.
Share the statistic on social media channels or embed the statistic in your
website using "Embed Code", where available.
Cite this statistic and select one of the following formats: APA, Chicago, Harvard, MLA & Bluebook.
Print the statistic including description and metadata.
Chart type
Average number of cinema visits to watch animation within the previous year in South Korea as of June 2024, by gender
Share this statistic
You have no right to use this feature.
Make sure to contact us if you are interested in scientific citation.
You can upgrade your account to enable this functionality for all statistics.
This feature is not available with your current account.Request access
Learn more about how Statista can support your business.
Korea Creative Content Agency. (October 15, 2024). Average number of cinema visits to watch animation within the previous year in South Korea as of June 2024, by gender [Graph]. In Statista. Retrieved May 09, 2025, from https://www.statista.com/statistics/1044987/south-korea-number-of-movie-theatre-visits-to-watch-animation-by-gender/
Korea Creative Content Agency. "Average number of cinema visits to watch animation within the previous year in South Korea as of June 2024, by gender." Chart. October 15, 2024. Statista. Accessed May 09, 2025. https://www.statista.com/statistics/1044987/south-korea-number-of-movie-theatre-visits-to-watch-animation-by-gender/
Korea Creative Content Agency. (2024). Average number of cinema visits to watch animation within the previous year in South Korea as of June 2024, by gender. Statista. Statista Inc.. Accessed: May 09, 2025. https://www.statista.com/statistics/1044987/south-korea-number-of-movie-theatre-visits-to-watch-animation-by-gender/
Korea Creative Content Agency. "Average Number of Cinema Visits to Watch Animation within The Previous Year in South Korea as of June 2024, by Gender." Statista, Statista Inc., 15 Oct 2024, https://www.statista.com/statistics/1044987/south-korea-number-of-movie-theatre-visits-to-watch-animation-by-gender/
Korea Creative Content Agency, Average number of cinema visits to watch animation within the previous year in South Korea as of June 2024, by gender Statista, https://www.statista.com/statistics/1044987/south-korea-number-of-movie-theatre-visits-to-watch-animation-by-gender/ (last visited May 09, 2025)
Average number of cinema visits to watch animation within the previous year in South Korea as of June 2024, by gender [Graph], Korea Creative Content Agency, October 15, 2024. [Online]. Available: https://www.statista.com/statistics/1044987/south-korea-number-of-movie-theatre-visits-to-watch-animation-by-gender/
Profit from additional features with an Employee Account
Please create an employee account to be able to mark statistics as favorites.
Then you can access your favorite statistics via the star in the header.
Profit from the additional features of your individual account
Currently, you are using a shared account. To use individual functions (e.g., mark statistics as favourites, set
statistic alerts) please log in with your personal account.
If you are an admin, please authenticate by logging in again.