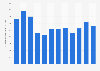
In 2024, households in South Korea spent an average of around 4,640 thousand South Korean won per month on plant related goods. In total, around 216,000 South Korean won were spent on entertainment and culture per household per month.
Advertisement
Advertisement
Average monthly expenditure on plant related goods per household in South Korea from 2017 to 2024
(in 1,000 South Korean won)
Profit from the additional features of your individual account
Currently, you are using a shared account. To use individual functions (e.g., mark statistics as favourites, set
statistic alerts) please log in with your personal account.
If you are an admin, please authenticate by logging in again.
Learn more about how Statista can support your business.
KOSIS. (February 27, 2025). Average monthly expenditure on plant related goods per household in South Korea from 2017 to 2024 (in 1,000 South Korean won) [Graph]. In Statista. Retrieved July 04, 2025, from https://www.statista.com/statistics/1049065/south-korea-monthly-household-expenditure-on-plant-related-goods/
KOSIS. "Average monthly expenditure on plant related goods per household in South Korea from 2017 to 2024 (in 1,000 South Korean won)." Chart. February 27, 2025. Statista. Accessed July 04, 2025. https://www.statista.com/statistics/1049065/south-korea-monthly-household-expenditure-on-plant-related-goods/
KOSIS. (2025). Average monthly expenditure on plant related goods per household in South Korea from 2017 to 2024 (in 1,000 South Korean won). Statista. Statista Inc.. Accessed: July 04, 2025. https://www.statista.com/statistics/1049065/south-korea-monthly-household-expenditure-on-plant-related-goods/
KOSIS. "Average Monthly Expenditure on Plant Related Goods per Household in South Korea from 2017 to 2024 (in 1,000 South Korean Won)." Statista, Statista Inc., 27 Feb 2025, https://www.statista.com/statistics/1049065/south-korea-monthly-household-expenditure-on-plant-related-goods/
KOSIS, Average monthly expenditure on plant related goods per household in South Korea from 2017 to 2024 (in 1,000 South Korean won) Statista, https://www.statista.com/statistics/1049065/south-korea-monthly-household-expenditure-on-plant-related-goods/ (last visited July 04, 2025)
Average monthly expenditure on plant related goods per household in South Korea from 2017 to 2024 (in 1,000 South Korean won) [Graph], KOSIS, February 27, 2025. [Online]. Available: https://www.statista.com/statistics/1049065/south-korea-monthly-household-expenditure-on-plant-related-goods/