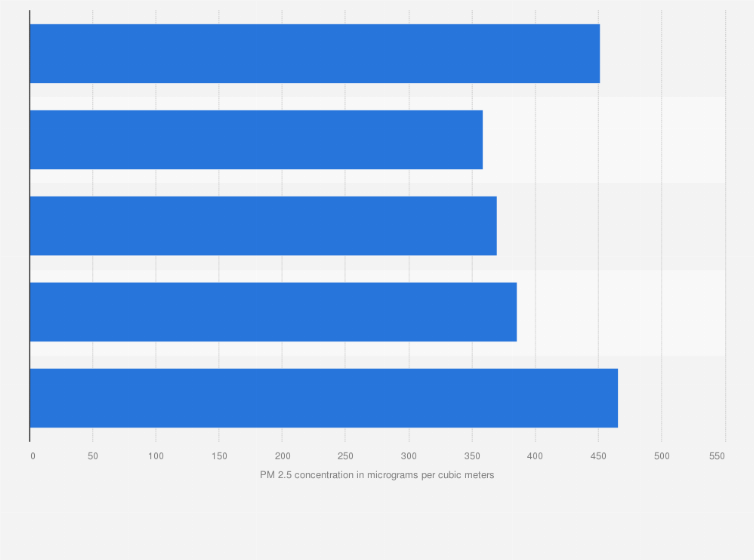
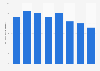
The concentration of PM 2.5 across the Indian city of Faridabad was about 466 micrograms per cubic meters in 2019.
The city was one of the most populated across the country in terms of air pollution a day after the festival of Diwali.
Advertisement
Advertisement
Concentration of PM 2.5 across Faridabad in India from 2015 to 2019
(in micrograms per cubic meters)
Characteristic
PM 2.5 concentration in micrograms per cubic meters
Adjust the presentation of the statistic and data points.
Share the statistic on social media channels or embed the statistic in your
website using "Embed Code", where available.
Cite this statistic and select one of the following formats: APA, Chicago, Harvard, MLA & Bluebook.
Print the statistic including description and metadata.
Chart type
Concentration of PM 2.5 across Faridabad in India from 2015 to 2019
Share this statistic
You have no right to use this feature.
Make sure to contact us if you are interested in scientific citation.
You can upgrade your account to enable this functionality for all statistics.
This feature is not available with your current account.Request access
Learn more about how Statista can support your business.
ASSOCHAM, & TechSci Research. (February 14, 2019). Concentration of PM 2.5 across Faridabad in India from 2015 to 2019 (in micrograms per cubic meters) [Graph]. In Statista. Retrieved July 04, 2025, from https://www.statista.com/statistics/1051320/india-pm-25-levels-in-faridabad/
ASSOCHAM, und TechSci Research. "Concentration of PM 2.5 across Faridabad in India from 2015 to 2019 (in micrograms per cubic meters)." Chart. February 14, 2019. Statista. Accessed July 04, 2025. https://www.statista.com/statistics/1051320/india-pm-25-levels-in-faridabad/
ASSOCHAM, TechSci Research. (2019). Concentration of PM 2.5 across Faridabad in India from 2015 to 2019 (in micrograms per cubic meters). Statista. Statista Inc.. Accessed: July 04, 2025. https://www.statista.com/statistics/1051320/india-pm-25-levels-in-faridabad/
ASSOCHAM, and TechSci Research. "Concentration of Pm 2.5 across Faridabad in India from 2015 to 2019 (in Micrograms per Cubic Meters)." Statista, Statista Inc., 14 Feb 2019, https://www.statista.com/statistics/1051320/india-pm-25-levels-in-faridabad/
ASSOCHAM & TechSci Research, Concentration of PM 2.5 across Faridabad in India from 2015 to 2019 (in micrograms per cubic meters) Statista, https://www.statista.com/statistics/1051320/india-pm-25-levels-in-faridabad/ (last visited July 04, 2025)
Concentration of PM 2.5 across Faridabad in India from 2015 to 2019 (in micrograms per cubic meters) [Graph], ASSOCHAM, & TechSci Research, February 14, 2019. [Online]. Available: https://www.statista.com/statistics/1051320/india-pm-25-levels-in-faridabad/
Advertisement
Profit from additional features with an Employee Account
Please create an employee account to be able to mark statistics as favorites.
Then you can access your favorite statistics via the star in the header.
Profit from the additional features of your individual account
Currently, you are using a shared account. To use individual functions (e.g., mark statistics as favourites, set
statistic alerts) please log in with your personal account.
If you are an admin, please authenticate by logging in again.