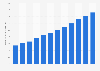
The revenues of the Norwegian bank DNB increased from 2009 to 2015. In 2015, the bank generated 54 billion Norwegian kroner. From 2015 and onwards the revenues declined, amounting to roughly 50.4 billion in 2018. In 2023, there was a significant increase to roughly 81.7 billion Norwegian kroner.
Profit from the additional features of your individual account
Currently, you are using a shared account. To use individual functions (e.g., mark statistics as favourites, set
statistic alerts) please log in with your personal account.
If you are an admin, please authenticate by logging in again.
Learn more about how Statista can support your business.
DNB. (March 15, 2024). Revenue of DNB from 2009 to 2023 (in million NOK) [Graph]. In Statista. Retrieved July 05, 2025, from https://www.statista.com/statistics/1051663/revenues-of-dnb/
DNB. "Revenue of DNB from 2009 to 2023 (in million NOK)." Chart. March 15, 2024. Statista. Accessed July 05, 2025. https://www.statista.com/statistics/1051663/revenues-of-dnb/
DNB. (2024). Revenue of DNB from 2009 to 2023 (in million NOK). Statista. Statista Inc.. Accessed: July 05, 2025. https://www.statista.com/statistics/1051663/revenues-of-dnb/
DNB. "Revenue of Dnb from 2009 to 2023 (in Million Nok)." Statista, Statista Inc., 15 Mar 2024, https://www.statista.com/statistics/1051663/revenues-of-dnb/
DNB, Revenue of DNB from 2009 to 2023 (in million NOK) Statista, https://www.statista.com/statistics/1051663/revenues-of-dnb/ (last visited July 05, 2025)
Revenue of DNB from 2009 to 2023 (in million NOK) [Graph], DNB, March 15, 2024. [Online]. Available: https://www.statista.com/statistics/1051663/revenues-of-dnb/