Profit from the additional features of your individual account
Currently, you are using a shared account. To use individual functions (e.g., mark statistics as favourites, set
statistic alerts) please log in with your personal account.
If you are an admin, please authenticate by logging in again.
Learn more about how Statista can support your business.
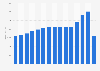
UN Comtrade. (December 15, 2023). Import value of optical goods worldwide from 2003 to 2022 (in billion U.S. dollars) [Graph]. In Statista. Retrieved July 12, 2025, from https://www.statista.com/statistics/1056169/optical-goods-import-value-worldwide/
UN Comtrade. "Import value of optical goods worldwide from 2003 to 2022 (in billion U.S. dollars)." Chart. December 15, 2023. Statista. Accessed July 12, 2025. https://www.statista.com/statistics/1056169/optical-goods-import-value-worldwide/
UN Comtrade. (2023). Import value of optical goods worldwide from 2003 to 2022 (in billion U.S. dollars). Statista. Statista Inc.. Accessed: July 12, 2025. https://www.statista.com/statistics/1056169/optical-goods-import-value-worldwide/
UN Comtrade. "Import Value of Optical Goods Worldwide from 2003 to 2022 (in Billion U.S. Dollars)." Statista, Statista Inc., 15 Dec 2023, https://www.statista.com/statistics/1056169/optical-goods-import-value-worldwide/
UN Comtrade, Import value of optical goods worldwide from 2003 to 2022 (in billion U.S. dollars) Statista, https://www.statista.com/statistics/1056169/optical-goods-import-value-worldwide/ (last visited July 12, 2025)
Import value of optical goods worldwide from 2003 to 2022 (in billion U.S. dollars) [Graph], UN Comtrade, December 15, 2023. [Online]. Available: https://www.statista.com/statistics/1056169/optical-goods-import-value-worldwide/