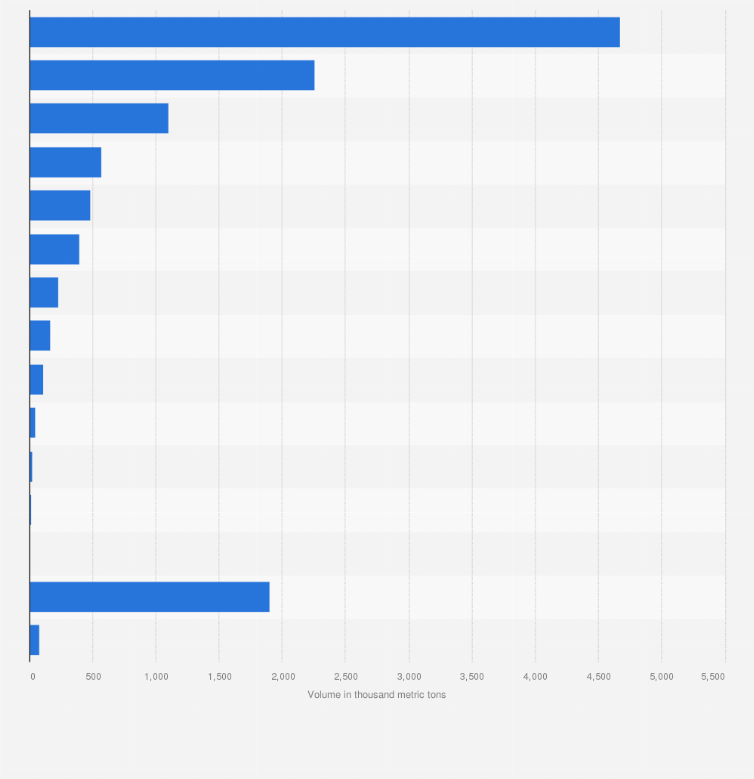
In 2018, the volume of unloaded goods handled between Swedish ports amounted to more than 12 million metric tons. During that year, carbon and refined petroleum products were the most common goods transported, reaching roughly 4.7 million metric tons. Furthermore, around 2.3 million metric tons of ore and 570 thousand metric tons of wood and wooden/paper products were domestically transported by ship in Sweden.
Volume of unloaded goods handled between Swedish ports in 2018, by commodity group
(in 1,000 metric tons)
Adjust the presentation of the statistic and data points.
Share the statistic on social media channels or embed the statistic in your
website using "Embed Code", where available.
Cite this statistic and select one of the following formats: APA, Chicago, Harvard, MLA & Bluebook.
Print the statistic including description and metadata.
Chart type
Volume of unloaded goods handled between Swedish ports in 2018, by commodity group
Share this statistic
You have no right to use this feature.
Make sure to contact us if you are interested in scientific citation.
You can upgrade your account to enable this functionality for all statistics.
This feature is not available with your current account.Request access
Learn more about how Statista can support your business.
Trafikanalys. (May 28, 2019). Volume of unloaded goods handled between Swedish ports in 2018, by commodity group (in 1,000 metric tons) [Graph]. In Statista. Retrieved May 09, 2025, from https://www.statista.com/statistics/1057747/volume-of-unloaded-goods-handled-between-swedish-ports-by-commodity/
Trafikanalys. "Volume of unloaded goods handled between Swedish ports in 2018, by commodity group (in 1,000 metric tons)." Chart. May 28, 2019. Statista. Accessed May 09, 2025. https://www.statista.com/statistics/1057747/volume-of-unloaded-goods-handled-between-swedish-ports-by-commodity/
Trafikanalys. (2019). Volume of unloaded goods handled between Swedish ports in 2018, by commodity group (in 1,000 metric tons). Statista. Statista Inc.. Accessed: May 09, 2025. https://www.statista.com/statistics/1057747/volume-of-unloaded-goods-handled-between-swedish-ports-by-commodity/
Trafikanalys. "Volume of Unloaded Goods Handled between Swedish Ports in 2018, by Commodity Group (in 1,000 Metric Tons)." Statista, Statista Inc., 28 May 2019, https://www.statista.com/statistics/1057747/volume-of-unloaded-goods-handled-between-swedish-ports-by-commodity/
Trafikanalys, Volume of unloaded goods handled between Swedish ports in 2018, by commodity group (in 1,000 metric tons) Statista, https://www.statista.com/statistics/1057747/volume-of-unloaded-goods-handled-between-swedish-ports-by-commodity/ (last visited May 09, 2025)
Volume of unloaded goods handled between Swedish ports in 2018, by commodity group (in 1,000 metric tons) [Graph], Trafikanalys, May 28, 2019. [Online]. Available: https://www.statista.com/statistics/1057747/volume-of-unloaded-goods-handled-between-swedish-ports-by-commodity/
Profit from additional features with an Employee Account
Please create an employee account to be able to mark statistics as favorites.
Then you can access your favorite statistics via the star in the header.
Profit from the additional features of your individual account
Currently, you are using a shared account. To use individual functions (e.g., mark statistics as favourites, set
statistic alerts) please log in with your personal account.
If you are an admin, please authenticate by logging in again.