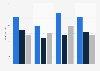
In a survey from April 2021, 29 percent more Russians noticed an increase in their online shopping activity for food products than a decrease. The difference between those recording a higher and lower frequency of purchasing home care products was measured at 17 percent.
Advertisement
Advertisement
Change in the online purchasing frequency in Russia in 2021, by product
You have no right to use this feature.
Make sure to contact us if you are interested in scientific citation.
You can upgrade your account to enable this functionality for all statistics.
This feature is not available with your current account.Request access
Changes in purchasing frequency were calculated based on balance as "the share of those who indicated higher use minus the share of those who indicated a less frequent use."
The source specified that the population sample represented eight federal districts of the country, over 200 localities.
Learn more about how Statista can support your business.
Deloitte. (June 25, 2021). Change in the online purchasing frequency in Russia in 2021, by product [Graph]. In Statista. Retrieved June 25, 2025, from https://www.statista.com/statistics/1059824/purchasing-frequency-change-by-product-in-russia/
Deloitte. "Change in the online purchasing frequency in Russia in 2021, by product." Chart. June 25, 2021. Statista. Accessed June 25, 2025. https://www.statista.com/statistics/1059824/purchasing-frequency-change-by-product-in-russia/
Deloitte. (2021). Change in the online purchasing frequency in Russia in 2021, by product. Statista. Statista Inc.. Accessed: June 25, 2025. https://www.statista.com/statistics/1059824/purchasing-frequency-change-by-product-in-russia/
Deloitte. "Change in The Online Purchasing Frequency in Russia in 2021, by Product." Statista, Statista Inc., 25 Jun 2021, https://www.statista.com/statistics/1059824/purchasing-frequency-change-by-product-in-russia/
Deloitte, Change in the online purchasing frequency in Russia in 2021, by product Statista, https://www.statista.com/statistics/1059824/purchasing-frequency-change-by-product-in-russia/ (last visited June 25, 2025)
Change in the online purchasing frequency in Russia in 2021, by product [Graph], Deloitte, June 25, 2021. [Online]. Available: https://www.statista.com/statistics/1059824/purchasing-frequency-change-by-product-in-russia/
Advertisement
Profit from additional features with an Employee Account
Please create an employee account to be able to mark statistics as favorites.
Then you can access your favorite statistics via the star in the header.
Profit from the additional features of your individual account
Currently, you are using a shared account. To use individual functions (e.g., mark statistics as favourites, set
statistic alerts) please log in with your personal account.
If you are an admin, please authenticate by logging in again.