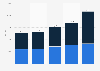
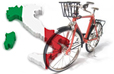
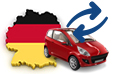
The number of bikes used in bike sharing services in Italy more than doubled between 2016 and 2017, passing from 16.3 thousand to 39.5 thousand. By contrast, the size of the car sharing fleet was much smaller, amounting to 6.5 thousand vehicles as of 2018. That year, scooter sharing became more widespread: the number of moto scooters used in shared mobility services increased fourfold compared to 2017.
Adjust the presentation of the statistic and data points.
Share the statistic on social media channels or embed the statistic in your
website using "Embed Code", where available.
Cite this statistic and select one of the following formats: APA, Chicago, Harvard, MLA & Bluebook.
Print the statistic including description and metadata.
Chart type
Number of vehicles used in sharing mobility services in Italy from 2015 to 2018, by vehicle type
Share this statistic
You have no right to use this feature.
Make sure to contact us if you are interested in scientific citation.
You can upgrade your account to enable this functionality for all statistics.
This feature is not available with your current account.Request access
Learn more about how Statista can support your business.
Energy & Strategy Group. (September 26, 2019). Number of vehicles used in sharing mobility services in Italy from 2015 to 2018, by vehicle type (in 1,000s) [Graph]. In Statista. Retrieved June 29, 2025, from https://www.statista.com/statistics/1061939/sharing-mobility-fleet-size-by-type-in-italy/
Energy & Strategy Group. "Number of vehicles used in sharing mobility services in Italy from 2015 to 2018, by vehicle type (in 1,000s)." Chart. September 26, 2019. Statista. Accessed June 29, 2025. https://www.statista.com/statistics/1061939/sharing-mobility-fleet-size-by-type-in-italy/
Energy & Strategy Group. (2019). Number of vehicles used in sharing mobility services in Italy from 2015 to 2018, by vehicle type (in 1,000s). Statista. Statista Inc.. Accessed: June 29, 2025. https://www.statista.com/statistics/1061939/sharing-mobility-fleet-size-by-type-in-italy/
Energy & Strategy Group. "Number of Vehicles Used in Sharing Mobility Services in Italy from 2015 to 2018, by Vehicle Type (in 1,000s)." Statista, Statista Inc., 26 Sep 2019, https://www.statista.com/statistics/1061939/sharing-mobility-fleet-size-by-type-in-italy/
Energy & Strategy Group, Number of vehicles used in sharing mobility services in Italy from 2015 to 2018, by vehicle type (in 1,000s) Statista, https://www.statista.com/statistics/1061939/sharing-mobility-fleet-size-by-type-in-italy/ (last visited June 29, 2025)
Number of vehicles used in sharing mobility services in Italy from 2015 to 2018, by vehicle type (in 1,000s) [Graph], Energy & Strategy Group, September 26, 2019. [Online]. Available: https://www.statista.com/statistics/1061939/sharing-mobility-fleet-size-by-type-in-italy/
Advertisement
Profit from additional features with an Employee Account
Please create an employee account to be able to mark statistics as favorites.
Then you can access your favorite statistics via the star in the header.
Profit from the additional features of your individual account
Currently, you are using a shared account. To use individual functions (e.g., mark statistics as favourites, set
statistic alerts) please log in with your personal account.
If you are an admin, please authenticate by logging in again.