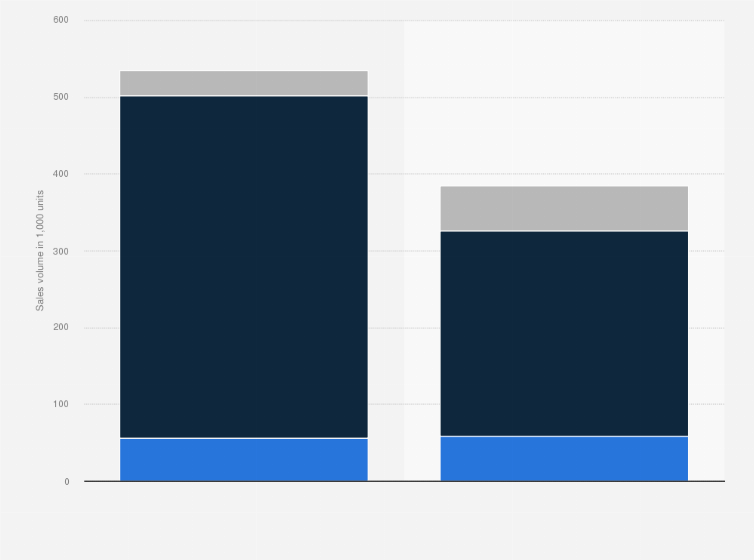
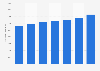
In 2019, GAC group sold over 267 thousands of SUV. GAC Group is a Chinese automobile manufacturer headquartered in Guangzhou, and a subsidiary of Guangzhou Automobile Industry Group (GAIG).
Advertisement
Advertisement
Sales volume of vehicles for Guangzhou Automobile Group (GAC) from 2018 to 2019, by category
(in 1,000 units)
Adjust the presentation of the statistic and data points.
Share the statistic on social media channels or embed the statistic in your
website using "Embed Code", where available.
Cite this statistic and select one of the following formats: APA, Chicago, Harvard, MLA & Bluebook.
Print the statistic including description and metadata.
Chart type
Sales volume of vehicles for Guangzhou Automobile Group (GAC) from 2018 to 2019, by category
Share this statistic
You have no right to use this feature.
Make sure to contact us if you are interested in scientific citation.
You can upgrade your account to enable this functionality for all statistics.
This feature is not available with your current account.Request access
Learn more about how Statista can support your business.
Guangzhou Automobile Group. (April 1, 2020). Sales volume of vehicles for Guangzhou Automobile Group (GAC) from 2018 to 2019, by category (in 1,000 units) [Graph]. In Statista. Retrieved June 19, 2025, from https://www.statista.com/statistics/1064518/vehicle-sales-volume-of-guangzhou-automobile-group-gac/
Guangzhou Automobile Group. "Sales volume of vehicles for Guangzhou Automobile Group (GAC) from 2018 to 2019, by category (in 1,000 units)." Chart. April 1, 2020. Statista. Accessed June 19, 2025. https://www.statista.com/statistics/1064518/vehicle-sales-volume-of-guangzhou-automobile-group-gac/
Guangzhou Automobile Group. (2020). Sales volume of vehicles for Guangzhou Automobile Group (GAC) from 2018 to 2019, by category (in 1,000 units). Statista. Statista Inc.. Accessed: June 19, 2025. https://www.statista.com/statistics/1064518/vehicle-sales-volume-of-guangzhou-automobile-group-gac/
Guangzhou Automobile Group. "Sales Volume of Vehicles for Guangzhou Automobile Group (Gac) from 2018 to 2019, by Category (in 1,000 Units)." Statista, Statista Inc., 1 Apr 2020, https://www.statista.com/statistics/1064518/vehicle-sales-volume-of-guangzhou-automobile-group-gac/
Guangzhou Automobile Group, Sales volume of vehicles for Guangzhou Automobile Group (GAC) from 2018 to 2019, by category (in 1,000 units) Statista, https://www.statista.com/statistics/1064518/vehicle-sales-volume-of-guangzhou-automobile-group-gac/ (last visited June 19, 2025)
Sales volume of vehicles for Guangzhou Automobile Group (GAC) from 2018 to 2019, by category (in 1,000 units) [Graph], Guangzhou Automobile Group, April 1, 2020. [Online]. Available: https://www.statista.com/statistics/1064518/vehicle-sales-volume-of-guangzhou-automobile-group-gac/
Advertisement
Profit from additional features with an Employee Account
Please create an employee account to be able to mark statistics as favorites.
Then you can access your favorite statistics via the star in the header.
Profit from the additional features of your individual account
Currently, you are using a shared account. To use individual functions (e.g., mark statistics as favourites, set
statistic alerts) please log in with your personal account.
If you are an admin, please authenticate by logging in again.