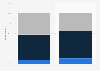
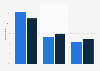
According to a survey on Indonesian consumers in 2018, households across all income groups had reduced their monthly household expenditure, with those earning between three to under five million rupiah reflecting the biggest reduction in household spending. This was in line with the results of the 2017 survey that reflected declining consumer sentiments in that year.
Advertisement
Advertisement
Year-on-year change in household expenditure levels by income group in Indonesia in 2018
Note: 1,000 Indonesian rupiah is equal to approximately 0.07 U.S. dollars and 0.064 euros (as of November 2019).
Breakdown of respondents by city:
Jakarta - 40%
Bandung - 15%
Surabaya - 15%
Medan - 15%
Makassar - 15%
Breakdown of respondents by income levels: <1 million rupiah- 38%
1-2 million rupiah - 32%
2-3 million rupiah - 14%
3-5 million rupiah - 10%
5-7.5 million rupiah - 4%
7.5-10 million rupiah -1%
>10 million rupiah - 1%.
Profit from the additional features of your individual account
Currently, you are using a shared account. To use individual functions (e.g., mark statistics as favourites, set
statistic alerts) please log in with your personal account.
If you are an admin, please authenticate by logging in again.
Learn more about how Statista can support your business.
Deloitte. (September 15, 2019). Year-on-year change in household expenditure levels by income group in Indonesia in 2018 [Graph]. In Statista. Retrieved June 17, 2025, from https://www.statista.com/statistics/1066367/indonesia-changes-in-household-expenditure-levels-by-income-group/
Deloitte. "Year-on-year change in household expenditure levels by income group in Indonesia in 2018." Chart. September 15, 2019. Statista. Accessed June 17, 2025. https://www.statista.com/statistics/1066367/indonesia-changes-in-household-expenditure-levels-by-income-group/
Deloitte. (2019). Year-on-year change in household expenditure levels by income group in Indonesia in 2018. Statista. Statista Inc.. Accessed: June 17, 2025. https://www.statista.com/statistics/1066367/indonesia-changes-in-household-expenditure-levels-by-income-group/
Deloitte. "Year-on-year Change in Household Expenditure Levels by Income Group in Indonesia in 2018." Statista, Statista Inc., 15 Sep 2019, https://www.statista.com/statistics/1066367/indonesia-changes-in-household-expenditure-levels-by-income-group/
Deloitte, Year-on-year change in household expenditure levels by income group in Indonesia in 2018 Statista, https://www.statista.com/statistics/1066367/indonesia-changes-in-household-expenditure-levels-by-income-group/ (last visited June 17, 2025)
Year-on-year change in household expenditure levels by income group in Indonesia in 2018 [Graph], Deloitte, September 15, 2019. [Online]. Available: https://www.statista.com/statistics/1066367/indonesia-changes-in-household-expenditure-levels-by-income-group/