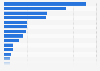
This graph represents the revenue generated by online sales (including mobile applications) in France from 2008 to 2019, depending on the number of people employed. In 2019, organizations employing between 10 and 19 people generated more than six billion euros in revenue on the Internet.
Advertisement
Advertisement
Revenue generated by online sales in France from 2008 to 2019 (in million euros), by number of people employed
Characteristic
10 to 19 employees
20 to 49 employees
50 to 249 employees
250 or more employees
2019
6,038.7
24,489.38
24,203.54
162,402.39
2018
9,045.88
14,486.74
22,475.63
224,756.25
2017
10,014.56
12,654.65
25,499.58
172,809.51
2016
8,954.47
9,121.61
23,290.91
137,522.1
2015
8,923.91
12,554.1
19,587.61
107,492.66
2014
7,623.03
9,609.02
31,618.2
87,201.28
2013
3,044.54
6,285.29
28,086.12
69,317.34
2012
5,985.6
10,048.69
25,573.25
69,884.51
2011
5,706.48
7,305.17
21,074.81
60,405.54
2010
3,996.84
4,852.31
9,245.77
52,599.82
2009
3,006.95
4,639.02
10,775.63
58,165.29
2008
6,248.81
9,134.25
11,422.06
55,847.6
050,000100,000150,000200,000250,000300,000
Add this content to your personal favorites. These can be accessed from the favorites menu in the main navigation.
You have no right to use this feature.
Make sure to contact us if you are interested in scientific citation.
You can upgrade your account to enable this functionality for all statistics.
This feature is not available with your current account.Request access
Learn more about how Statista can support your business.
Insee. (April 21, 2021). Revenue generated by online sales in France from 2008 to 2019 (in million euros), by number of people employed [Graph]. In Statista. Retrieved July 19, 2025, from https://www.statista.com/statistics/1068593/online-sales-revenue-company-size-france/
Insee. "Revenue generated by online sales in France from 2008 to 2019 (in million euros), by number of people employed." Chart. April 21, 2021. Statista. Accessed July 19, 2025. https://www.statista.com/statistics/1068593/online-sales-revenue-company-size-france/
Insee. (2021). Revenue generated by online sales in France from 2008 to 2019 (in million euros), by number of people employed. Statista. Statista Inc.. Accessed: July 19, 2025. https://www.statista.com/statistics/1068593/online-sales-revenue-company-size-france/
Insee. "Revenue Generated by Online Sales in France from 2008 to 2019 (in Million Euros), by Number of People Employed." Statista, Statista Inc., 21 Apr 2021, https://www.statista.com/statistics/1068593/online-sales-revenue-company-size-france/
Insee, Revenue generated by online sales in France from 2008 to 2019 (in million euros), by number of people employed Statista, https://www.statista.com/statistics/1068593/online-sales-revenue-company-size-france/ (last visited July 19, 2025)
Revenue generated by online sales in France from 2008 to 2019 (in million euros), by number of people employed [Graph], Insee, April 21, 2021. [Online]. Available: https://www.statista.com/statistics/1068593/online-sales-revenue-company-size-france/
Advertisement
Profit from additional features with an Employee Account
Please create an employee account to be able to mark statistics as favorites.
Then you can access your favorite statistics via the star in the header.
Profit from the additional features of your individual account
Currently, you are using a shared account. To use individual functions (e.g., mark statistics as favourites, set
statistic alerts) please log in with your personal account.
If you are an admin, please authenticate by logging in again.