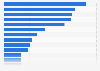
This diagram shows the distribution of the members of the National Assembly in France in 2017, according to their occupation. As a result, the majority of representatives elected in June 2017 were managers in the private sector.
Profit from the additional features of your individual account
Currently, you are using a shared account. To use individual functions (e.g., mark statistics as favourites, set
statistic alerts) please log in with your personal account.
If you are an admin, please authenticate by logging in again.
Learn more about how Statista can support your business.
Le Monde. (June 26, 2017). Distribution of the members of the French National Assembly in 2017, by occupation [Graph]. In Statista. Retrieved June 12, 2025, from https://www.statista.com/statistics/1069552/members-national-assembly-by-occupation-france/
Le Monde. "Distribution of the members of the French National Assembly in 2017, by occupation." Chart. June 26, 2017. Statista. Accessed June 12, 2025. https://www.statista.com/statistics/1069552/members-national-assembly-by-occupation-france/
Le Monde. (2017). Distribution of the members of the French National Assembly in 2017, by occupation. Statista. Statista Inc.. Accessed: June 12, 2025. https://www.statista.com/statistics/1069552/members-national-assembly-by-occupation-france/
Le Monde. "Distribution of The Members of The French National Assembly in 2017, by Occupation." Statista, Statista Inc., 26 Jun 2017, https://www.statista.com/statistics/1069552/members-national-assembly-by-occupation-france/
Le Monde, Distribution of the members of the French National Assembly in 2017, by occupation Statista, https://www.statista.com/statistics/1069552/members-national-assembly-by-occupation-france/ (last visited June 12, 2025)
Distribution of the members of the French National Assembly in 2017, by occupation [Graph], Le Monde, June 26, 2017. [Online]. Available: https://www.statista.com/statistics/1069552/members-national-assembly-by-occupation-france/