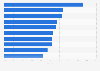
Since 2012, when the historic high of over 17 thousand sold buses was recorded in Russia, the sales volume of such vehicles decreased significantly, measuring at about nine thousand in 2015. Figures recovered gradually over the following years and by 2019 sales volume amounted to 14 thousand cars.
Sales volume of buses in the Russian car market from 2010 to 2019
(in 1,000s)
Profit from the additional features of your individual account
Currently, you are using a shared account. To use individual functions (e.g., mark statistics as favourites, set
statistic alerts) please log in with your personal account.
If you are an admin, please authenticate by logging in again.
Learn more about how Statista can support your business.
EY. (March 30, 2020). Sales volume of buses in the Russian car market from 2010 to 2019 (in 1,000s) [Graph]. In Statista. Retrieved May 04, 2025, from https://www.statista.com/statistics/1071125/sales-volume-of-buses-in-russia/
EY. "Sales volume of buses in the Russian car market from 2010 to 2019 (in 1,000s)." Chart. March 30, 2020. Statista. Accessed May 04, 2025. https://www.statista.com/statistics/1071125/sales-volume-of-buses-in-russia/
EY. (2020). Sales volume of buses in the Russian car market from 2010 to 2019 (in 1,000s). Statista. Statista Inc.. Accessed: May 04, 2025. https://www.statista.com/statistics/1071125/sales-volume-of-buses-in-russia/
EY. "Sales Volume of Buses in The Russian Car Market from 2010 to 2019 (in 1,000s)." Statista, Statista Inc., 30 Mar 2020, https://www.statista.com/statistics/1071125/sales-volume-of-buses-in-russia/
EY, Sales volume of buses in the Russian car market from 2010 to 2019 (in 1,000s) Statista, https://www.statista.com/statistics/1071125/sales-volume-of-buses-in-russia/ (last visited May 04, 2025)
Sales volume of buses in the Russian car market from 2010 to 2019 (in 1,000s) [Graph], EY, March 30, 2020. [Online]. Available: https://www.statista.com/statistics/1071125/sales-volume-of-buses-in-russia/