In 2021, Allscripts healthcare solutions earned roughly 916 million U.S. dollars from its software delivery, support and maintenance sales, slightly down from approximately 1 billion U.S. dollars in 2018. The statistic illustrates Allscripts healthcare inc. revenue from 2018 to 2021 (in million of U.S. dollar).
Advertisement
Advertisement
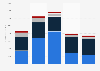
Allscripts Healthcare Solutions' revenue from 2018 to 2021, by segment
(in million U.S. dollars)
Characteristic
Software delivery, support and maintenance
Client services
2021
916.18
586.85
2020
923.73
578.96
2019
1,010.99
621.61
2018
1,011.62
606.22
02505007501,0001,250
Add this content to your personal favorites. These can be accessed from the favorites menu in the main navigation.
You have no right to use this feature.
Make sure to contact us if you are interested in scientific citation.
You can upgrade your account to enable this functionality for all statistics.
This feature is not available with your current account.Request access
Learn more about how Statista can support your business.
Allscripts. (February 25, 2022). Allscripts Healthcare Solutions' revenue from 2018 to 2021, by segment (in million U.S. dollars) [Graph]. In Statista. Retrieved July 07, 2025, from https://www.statista.com/statistics/1073897/allscripts-revenue-by-segment/
Allscripts. "Allscripts Healthcare Solutions' revenue from 2018 to 2021, by segment (in million U.S. dollars)." Chart. February 25, 2022. Statista. Accessed July 07, 2025. https://www.statista.com/statistics/1073897/allscripts-revenue-by-segment/
Allscripts. (2022). Allscripts Healthcare Solutions' revenue from 2018 to 2021, by segment (in million U.S. dollars). Statista. Statista Inc.. Accessed: July 07, 2025. https://www.statista.com/statistics/1073897/allscripts-revenue-by-segment/
Allscripts. "Allscripts Healthcare Solutions' Revenue from 2018 to 2021, by Segment (in Million U.S. Dollars)." Statista, Statista Inc., 25 Feb 2022, https://www.statista.com/statistics/1073897/allscripts-revenue-by-segment/
Allscripts, Allscripts Healthcare Solutions' revenue from 2018 to 2021, by segment (in million U.S. dollars) Statista, https://www.statista.com/statistics/1073897/allscripts-revenue-by-segment/ (last visited July 07, 2025)
Allscripts Healthcare Solutions' revenue from 2018 to 2021, by segment (in million U.S. dollars) [Graph], Allscripts, February 25, 2022. [Online]. Available: https://www.statista.com/statistics/1073897/allscripts-revenue-by-segment/
Advertisement
Profit from additional features with an Employee Account
Please create an employee account to be able to mark statistics as favorites.
Then you can access your favorite statistics via the star in the header.
Profit from the additional features of your individual account
Currently, you are using a shared account. To use individual functions (e.g., mark statistics as favourites, set
statistic alerts) please log in with your personal account.
If you are an admin, please authenticate by logging in again.