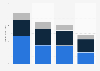
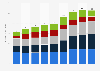
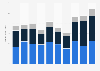
In 2023, the value added by the services industry to the gross domestic product in Chile remained nearly unchanged at around 175.63 billion U.S. dollars. Still, the value added reached its highest value in the observed period in 2023. Value added is the value of the gross output of producers less the value of intermediate goods and services consumed in production, before accounting for consumption of fixed capital in production.
Values in constant U.S. dollars based on 2015 prices
Supplementary notes
Data represents the value added in wholesale and retail trade (including hotels and restaurants), transport, and government, financial, professional, and personal services such as education, health care, and real estate services. Also included are imputed bank service charges, import duties, and any statistical discrepancies noted by national compilers as well as discrepancies arising from rescaling. Value added is the net output of a sector after adding up all outputs and subtracting intermediate inputs. It is calculated without making deductions for depreciation of fabricated assets or depletion and degradation of natural resources.
The source does not provide a date of release, the date given is the one of last access. Figures have been rounded.
Profit from the additional features of your individual account
Currently, you are using a shared account. To use individual functions (e.g., mark statistics as favourites, set
statistic alerts) please log in with your personal account.
If you are an admin, please authenticate by logging in again.
Learn more about how Statista can support your business.
World Bank. (March 24, 2025). Value added by the services industry to the gross domestic product (GDP) in Chile from 2012 to 2023 (in billion U.S. dollars) [Graph]. In Statista. Retrieved June 12, 2025, from https://www.statista.com/statistics/1074805/chile-services-sector-value-added-gdp/
World Bank. "Value added by the services industry to the gross domestic product (GDP) in Chile from 2012 to 2023 (in billion U.S. dollars)." Chart. March 24, 2025. Statista. Accessed June 12, 2025. https://www.statista.com/statistics/1074805/chile-services-sector-value-added-gdp/
World Bank. (2025). Value added by the services industry to the gross domestic product (GDP) in Chile from 2012 to 2023 (in billion U.S. dollars). Statista. Statista Inc.. Accessed: June 12, 2025. https://www.statista.com/statistics/1074805/chile-services-sector-value-added-gdp/
World Bank. "Value Added by The Services Industry to The Gross Domestic Product (Gdp) in Chile from 2012 to 2023 (in Billion U.S. Dollars)." Statista, Statista Inc., 24 Mar 2025, https://www.statista.com/statistics/1074805/chile-services-sector-value-added-gdp/
World Bank, Value added by the services industry to the gross domestic product (GDP) in Chile from 2012 to 2023 (in billion U.S. dollars) Statista, https://www.statista.com/statistics/1074805/chile-services-sector-value-added-gdp/ (last visited June 12, 2025)
Value added by the services industry to the gross domestic product (GDP) in Chile from 2012 to 2023 (in billion U.S. dollars) [Graph], World Bank, March 24, 2025. [Online]. Available: https://www.statista.com/statistics/1074805/chile-services-sector-value-added-gdp/