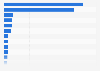
In 2018, many of the Italian cities with the highest yearly average concentration of particulate matter (PM 10) were located either in Sicily or in the Po Valley. No city, however, exceeded the European target value of 40 micrograms per cubic meter (µg/m3).
Advertisement
Advertisement
Average annual concentration of particulate matter (PM 10) in selected Italian cities in 2018
(in micrograms per cubic meter)
Characteristic
Average concentration in micrograms per cubic meter
Profit from the additional features of your individual account
Currently, you are using a shared account. To use individual functions (e.g., mark statistics as favourites, set
statistic alerts) please log in with your personal account.
If you are an admin, please authenticate by logging in again.
Learn more about how Statista can support your business.
Legambiente. (October 28, 2019). Average annual concentration of particulate matter (PM 10) in selected Italian cities in 2018 (in micrograms per cubic meter) [Graph]. In Statista. Retrieved June 18, 2025, from https://www.statista.com/statistics/1077724/cities-with-highest-particulate-matter-concentration-italy/
Legambiente. "Average annual concentration of particulate matter (PM 10) in selected Italian cities in 2018 (in micrograms per cubic meter)." Chart. October 28, 2019. Statista. Accessed June 18, 2025. https://www.statista.com/statistics/1077724/cities-with-highest-particulate-matter-concentration-italy/
Legambiente. (2019). Average annual concentration of particulate matter (PM 10) in selected Italian cities in 2018 (in micrograms per cubic meter). Statista. Statista Inc.. Accessed: June 18, 2025. https://www.statista.com/statistics/1077724/cities-with-highest-particulate-matter-concentration-italy/
Legambiente. "Average Annual Concentration of Particulate Matter (Pm 10) in Selected Italian Cities in 2018 (in Micrograms per Cubic Meter)." Statista, Statista Inc., 28 Oct 2019, https://www.statista.com/statistics/1077724/cities-with-highest-particulate-matter-concentration-italy/
Legambiente, Average annual concentration of particulate matter (PM 10) in selected Italian cities in 2018 (in micrograms per cubic meter) Statista, https://www.statista.com/statistics/1077724/cities-with-highest-particulate-matter-concentration-italy/ (last visited June 18, 2025)
Average annual concentration of particulate matter (PM 10) in selected Italian cities in 2018 (in micrograms per cubic meter) [Graph], Legambiente, October 28, 2019. [Online]. Available: https://www.statista.com/statistics/1077724/cities-with-highest-particulate-matter-concentration-italy/