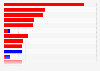
In 2018, Massachusetts was the state that leaned most toward the Democratic Party, with ** percent of people surveyed throughout the year stating they either identify with or lean towards the Democrats. On the other end of the political spectrum, ** percent of respondents in Wyoming preferred the Republican Party.
Profit from the additional features of your individual account
Currently, you are using a shared account. To use individual functions (e.g., mark statistics as favourites, set
statistic alerts) please log in with your personal account.
If you are an admin, please authenticate by logging in again.
Learn more about how Statista can support your business.
Gallup. (February 22, 2019). Identification with political parties in the United States in 2018, by state [Graph]. In Statista. Retrieved July 12, 2025, from https://www.statista.com/statistics/1080003/political-party-identification-state-us/
Gallup. "Identification with political parties in the United States in 2018, by state." Chart. February 22, 2019. Statista. Accessed July 12, 2025. https://www.statista.com/statistics/1080003/political-party-identification-state-us/
Gallup. (2019). Identification with political parties in the United States in 2018, by state. Statista. Statista Inc.. Accessed: July 12, 2025. https://www.statista.com/statistics/1080003/political-party-identification-state-us/
Gallup. "Identification with Political Parties in The United States in 2018, by State." Statista, Statista Inc., 22 Feb 2019, https://www.statista.com/statistics/1080003/political-party-identification-state-us/
Gallup, Identification with political parties in the United States in 2018, by state Statista, https://www.statista.com/statistics/1080003/political-party-identification-state-us/ (last visited July 12, 2025)
Identification with political parties in the United States in 2018, by state [Graph], Gallup, February 22, 2019. [Online]. Available: https://www.statista.com/statistics/1080003/political-party-identification-state-us/