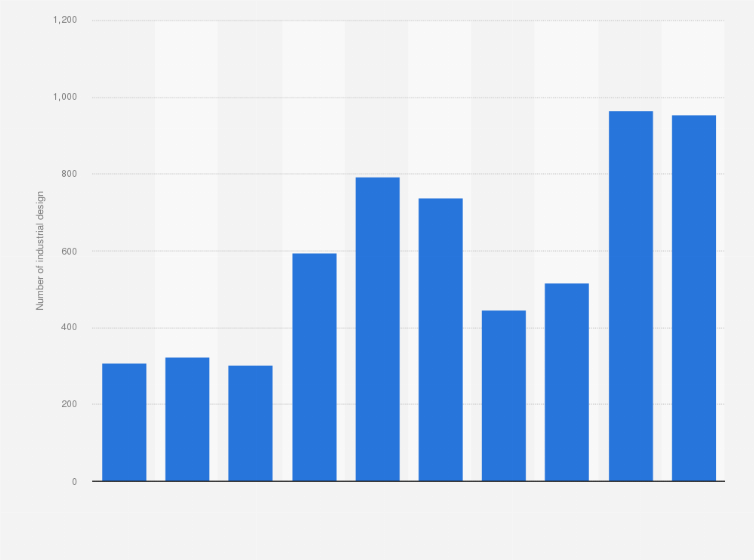
In 2018, approximately 955 intellectual property rights were granted for industrial designs to local applicants in the Philippines. In the same year, the total charges on the authorized use of intellectual property in the country were around 44 billion U.S. dollars.
Advertisement
Advertisement
Total number of intellectual property rights for industrial designs granted to local applicants in the Philippines from 2009 to 2018
Adjust the presentation of the statistic and data points.
Share the statistic on social media channels or embed the statistic in your
website using "Embed Code", where available.
Cite this statistic and select one of the following formats: APA, Chicago, Harvard, MLA & Bluebook.
Print the statistic including description and metadata.
Chart type
Total number of intellectual property rights for industrial designs granted to local applicants in the Philippines from 2009 to 2018
Share this statistic
You have no right to use this feature.
Make sure to contact us if you are interested in scientific citation.
You can upgrade your account to enable this functionality for all statistics.
This feature is not available with your current account.Request access
An industrial design is the ornamental or aesthetic aspect of an article. Design, in this sense, may be three-dimensional features (shape or surface of an article), or the two-dimensional features (patterns or lines of color). Handicrafts, jewelry, vehicles, appliances - the subject of industrial designs range from fashion to industrial goods.
Learn more about how Statista can support your business.
PSA (Philippines). (October 3, 2020). Total number of intellectual property rights for industrial designs granted to local applicants in the Philippines from 2009 to 2018 [Graph]. In Statista. Retrieved June 29, 2025, from https://www.statista.com/statistics/1080537/philippines-approved-industrial-design-to-local-applicants/
PSA (Philippines). "Total number of intellectual property rights for industrial designs granted to local applicants in the Philippines from 2009 to 2018." Chart. October 3, 2020. Statista. Accessed June 29, 2025. https://www.statista.com/statistics/1080537/philippines-approved-industrial-design-to-local-applicants/
PSA (Philippines). (2020). Total number of intellectual property rights for industrial designs granted to local applicants in the Philippines from 2009 to 2018. Statista. Statista Inc.. Accessed: June 29, 2025. https://www.statista.com/statistics/1080537/philippines-approved-industrial-design-to-local-applicants/
PSA (Philippines). "Total Number of Intellectual Property Rights for Industrial Designs Granted to Local Applicants in The Philippines from 2009 to 2018." Statista, Statista Inc., 3 Oct 2020, https://www.statista.com/statistics/1080537/philippines-approved-industrial-design-to-local-applicants/
PSA (Philippines), Total number of intellectual property rights for industrial designs granted to local applicants in the Philippines from 2009 to 2018 Statista, https://www.statista.com/statistics/1080537/philippines-approved-industrial-design-to-local-applicants/ (last visited June 29, 2025)
Total number of intellectual property rights for industrial designs granted to local applicants in the Philippines from 2009 to 2018 [Graph], PSA (Philippines), October 3, 2020. [Online]. Available: https://www.statista.com/statistics/1080537/philippines-approved-industrial-design-to-local-applicants/
Advertisement
Profit from additional features with an Employee Account
Please create an employee account to be able to mark statistics as favorites.
Then you can access your favorite statistics via the star in the header.
Profit from the additional features of your individual account
Currently, you are using a shared account. To use individual functions (e.g., mark statistics as favourites, set
statistic alerts) please log in with your personal account.
If you are an admin, please authenticate by logging in again.