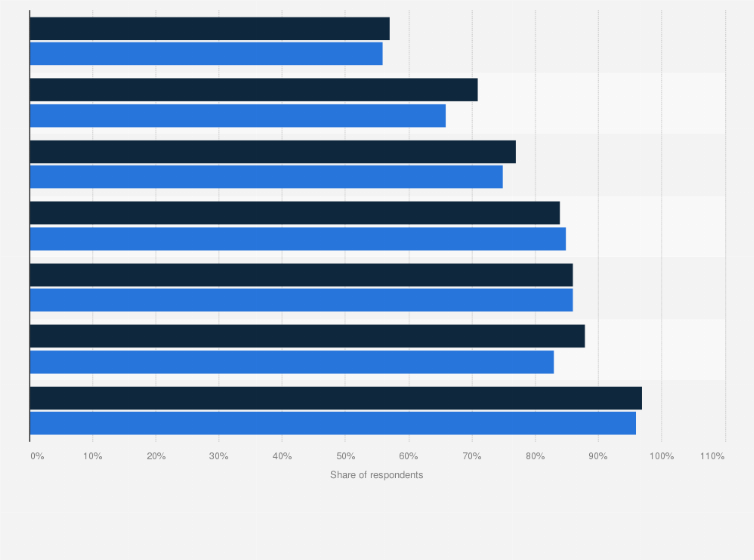
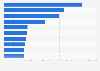
Between 2017 to 2018, respondents were generally more satisfied with the thoroughness of cleaning at public spaces in Singapore, especially at wet markets. In 2017, 66 percent were satisfied compared to 71 percent in 2018 who were satisfied with the rate of cleanliness there. According to the survey, respondents were allowed to rate their satisfaction on the thoroughness of cleaning, number of trash bins, time taken for follow-up action following cleanliness feedback, and the amount of enforcement against those who litter.
Share of respondents satisfied with the thoroughness of cleaning at different spaces in Singapore from 2017 to 2018
Adjust the presentation of the statistic and data points.
Share the statistic on social media channels or embed the statistic in your
website using "Embed Code", where available.
Cite this statistic and select one of the following formats: APA, Chicago, Harvard, MLA & Bluebook.
Print the statistic including description and metadata.
Chart type
Share of respondents satisfied with the thoroughness of cleaning at different spaces in Singapore from 2017 to 2018
Share this statistic
You have no right to use this feature.
Make sure to contact us if you are interested in scientific citation.
You can upgrade your account to enable this functionality for all statistics.
This feature is not available with your current account.Request access
The survey was conducted from August 2018 to December 2018. The first wave of this study was conducted between October 2016 to March 2017.
Over 2000 Singapore Citizens and Permanent Residents aged 21 years and above.
*Void Decks, Lift Lobbies, Lifts
Learn more about how Statista can support your business.
Singapore Management University. (November 30, 2019). Share of respondents satisfied with the thoroughness of cleaning at different spaces in Singapore from 2017 to 2018 [Graph]. In Statista. Retrieved May 04, 2025, from https://www.statista.com/statistics/1081278/singapore-satisfaction-of-cleanliness-at-public-spaces/
Singapore Management University. "Share of respondents satisfied with the thoroughness of cleaning at different spaces in Singapore from 2017 to 2018 ." Chart. November 30, 2019. Statista. Accessed May 04, 2025. https://www.statista.com/statistics/1081278/singapore-satisfaction-of-cleanliness-at-public-spaces/
Singapore Management University. (2019). Share of respondents satisfied with the thoroughness of cleaning at different spaces in Singapore from 2017 to 2018 . Statista. Statista Inc.. Accessed: May 04, 2025. https://www.statista.com/statistics/1081278/singapore-satisfaction-of-cleanliness-at-public-spaces/
Singapore Management University. "Share of Respondents Satisfied with The Thoroughness of Cleaning at Different Spaces in Singapore from 2017 to 2018 ." Statista, Statista Inc., 30 Nov 2019, https://www.statista.com/statistics/1081278/singapore-satisfaction-of-cleanliness-at-public-spaces/
Singapore Management University, Share of respondents satisfied with the thoroughness of cleaning at different spaces in Singapore from 2017 to 2018 Statista, https://www.statista.com/statistics/1081278/singapore-satisfaction-of-cleanliness-at-public-spaces/ (last visited May 04, 2025)
Share of respondents satisfied with the thoroughness of cleaning at different spaces in Singapore from 2017 to 2018 [Graph], Singapore Management University, November 30, 2019. [Online]. Available: https://www.statista.com/statistics/1081278/singapore-satisfaction-of-cleanliness-at-public-spaces/
Profit from additional features with an Employee Account
Please create an employee account to be able to mark statistics as favorites.
Then you can access your favorite statistics via the star in the header.
Profit from the additional features of your individual account
Currently, you are using a shared account. To use individual functions (e.g., mark statistics as favourites, set
statistic alerts) please log in with your personal account.
If you are an admin, please authenticate by logging in again.