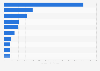
Almost 44 percent of travelers from Saudi Arabia to the United States in 2023 were visiting for business, work or conferences. This was the country with the highest share of business travelers in the U.S. that year, followed by Vietnam.
Advertisement
Advertisement
Countries with the highest share of business visitors to the United States in 2023, by type
You have no right to use this feature.
Make sure to contact us if you are interested in scientific citation.
You can upgrade your account to enable this functionality for all statistics.
This feature is not available with your current account.Request access
Learn more about how Statista can support your business.
International Trade Administration. (March 20, 2025). Countries with the highest share of business visitors to the United States in 2023, by type [Graph]. In Statista. Retrieved July 17, 2025, from https://www.statista.com/statistics/1081733/markets-most-business-travelers-united-states/
International Trade Administration. "Countries with the highest share of business visitors to the United States in 2023, by type." Chart. March 20, 2025. Statista. Accessed July 17, 2025. https://www.statista.com/statistics/1081733/markets-most-business-travelers-united-states/
International Trade Administration. (2025). Countries with the highest share of business visitors to the United States in 2023, by type. Statista. Statista Inc.. Accessed: July 17, 2025. https://www.statista.com/statistics/1081733/markets-most-business-travelers-united-states/
International Trade Administration. "Countries with The Highest Share of Business Visitors to The United States in 2023, by Type." Statista, Statista Inc., 20 Mar 2025, https://www.statista.com/statistics/1081733/markets-most-business-travelers-united-states/
International Trade Administration, Countries with the highest share of business visitors to the United States in 2023, by type Statista, https://www.statista.com/statistics/1081733/markets-most-business-travelers-united-states/ (last visited July 17, 2025)
Countries with the highest share of business visitors to the United States in 2023, by type [Graph], International Trade Administration, March 20, 2025. [Online]. Available: https://www.statista.com/statistics/1081733/markets-most-business-travelers-united-states/
Advertisement
Profit from additional features with an Employee Account
Please create an employee account to be able to mark statistics as favorites.
Then you can access your favorite statistics via the star in the header.
Profit from the additional features of your individual account
Currently, you are using a shared account. To use individual functions (e.g., mark statistics as favourites, set
statistic alerts) please log in with your personal account.
If you are an admin, please authenticate by logging in again.