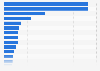
Fruits and vegetables accounted for about 258 billion Indian rupees from Gujarat to the Indian economy in fiscal year 2020. This value was an increase compared the fiscal year 2012. The state made up almostt seven percent of a nationwide share within this sector that year.
Gross value added from fruits and vegetables across Gujarat in India from financial year 2012 to 2020
(in billion Indian rupees)
Characteristic
Value in billion Indian rupees
FY 2020
258
FY 2019
250
FY 2018
253
FY 2017
246
FY 2016
246
FY 2015
227
FY 2014
209
FY 2013
199
FY 2012
187
050100150200250300
Add this content to your personal favorites. These can be accessed from the favorites menu in the main navigation.
You have no right to use this feature.
Make sure to contact us if you are interested in scientific citation.
You can upgrade your account to enable this functionality for all statistics.
This feature is not available with your current account.Request access
Learn more about how Statista can support your business.
MOSPI. (September 28, 2022). Gross value added from fruits and vegetables across Gujarat in India from financial year 2012 to 2020 (in billion Indian rupees) [Graph]. In Statista. Retrieved May 12, 2025, from https://www.statista.com/statistics/1082835/india-economic-contribution-of-fruits-and-vegetables-in-gj/
MOSPI. "Gross value added from fruits and vegetables across Gujarat in India from financial year 2012 to 2020 (in billion Indian rupees)." Chart. September 28, 2022. Statista. Accessed May 12, 2025. https://www.statista.com/statistics/1082835/india-economic-contribution-of-fruits-and-vegetables-in-gj/
MOSPI. (2022). Gross value added from fruits and vegetables across Gujarat in India from financial year 2012 to 2020 (in billion Indian rupees). Statista. Statista Inc.. Accessed: May 12, 2025. https://www.statista.com/statistics/1082835/india-economic-contribution-of-fruits-and-vegetables-in-gj/
MOSPI. "Gross Value Added from Fruits and Vegetables across Gujarat in India from Financial Year 2012 to 2020 (in Billion Indian Rupees)." Statista, Statista Inc., 28 Sep 2022, https://www.statista.com/statistics/1082835/india-economic-contribution-of-fruits-and-vegetables-in-gj/
MOSPI, Gross value added from fruits and vegetables across Gujarat in India from financial year 2012 to 2020 (in billion Indian rupees) Statista, https://www.statista.com/statistics/1082835/india-economic-contribution-of-fruits-and-vegetables-in-gj/ (last visited May 12, 2025)
Gross value added from fruits and vegetables across Gujarat in India from financial year 2012 to 2020 (in billion Indian rupees) [Graph], MOSPI, September 28, 2022. [Online]. Available: https://www.statista.com/statistics/1082835/india-economic-contribution-of-fruits-and-vegetables-in-gj/
Profit from additional features with an Employee Account
Please create an employee account to be able to mark statistics as favorites.
Then you can access your favorite statistics via the star in the header.
Profit from the additional features of your individual account
Currently, you are using a shared account. To use individual functions (e.g., mark statistics as favourites, set
statistic alerts) please log in with your personal account.
If you are an admin, please authenticate by logging in again.