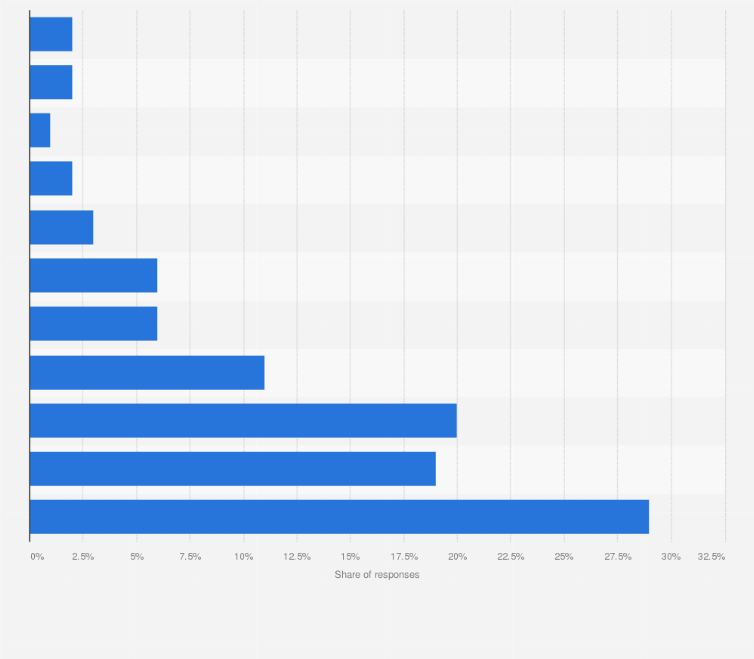
A 2018 survey of patient's experiences with NHS accident and emergency (A&E) departments in England showed that 29 percent of respondents would give their experience the highest rating possible. On the other hand, only two percent of respondents said they had a very poor experience.
Advertisement
Advertisement
Distribution of patient's rating of their overall experience with the accident and emergency (A&E) department in England in 2018
(on a scale of 0 to 10)
Adjust the presentation of the statistic and data points.
Share the statistic on social media channels or embed the statistic in your
website using "Embed Code", where available.
Cite this statistic and select one of the following formats: APA, Chicago, Harvard, MLA & Bluebook.
Print the statistic including description and metadata.
Chart type
Distribution of patient's rating of their overall experience with the accident and emergency (A&E) department in England in 2018
Share this statistic
You have no right to use this feature.
Make sure to contact us if you are interested in scientific citation.
You can upgrade your account to enable this functionality for all statistics.
This feature is not available with your current account.Request access
Learn more about how Statista can support your business.
NHS, & Care Quality Commission . (October 29, 2019). Distribution of patient's rating of their overall experience with the accident and emergency (A&E) department in England in 2018 (on a scale of 0 to 10) [Graph]. In Statista. Retrieved June 27, 2025, from https://www.statista.com/statistics/1084771/experience-with-aande-department-in-england/
NHS, und Care Quality Commission . "Distribution of patient's rating of their overall experience with the accident and emergency (A&E) department in England in 2018 (on a scale of 0 to 10)." Chart. October 29, 2019. Statista. Accessed June 27, 2025. https://www.statista.com/statistics/1084771/experience-with-aande-department-in-england/
NHS, Care Quality Commission . (2019). Distribution of patient's rating of their overall experience with the accident and emergency (A&E) department in England in 2018 (on a scale of 0 to 10). Statista. Statista Inc.. Accessed: June 27, 2025. https://www.statista.com/statistics/1084771/experience-with-aande-department-in-england/
NHS, and Care Quality Commission . "Distribution of Patient's Rating of Their Overall Experience with The Accident and Emergency (A&e) Department in England in 2018 (on a Scale of 0 to 10)." Statista, Statista Inc., 29 Oct 2019, https://www.statista.com/statistics/1084771/experience-with-aande-department-in-england/
NHS & Care Quality Commission , Distribution of patient's rating of their overall experience with the accident and emergency (A&E) department in England in 2018 (on a scale of 0 to 10) Statista, https://www.statista.com/statistics/1084771/experience-with-aande-department-in-england/ (last visited June 27, 2025)
Distribution of patient's rating of their overall experience with the accident and emergency (A&E) department in England in 2018 (on a scale of 0 to 10) [Graph], NHS, & Care Quality Commission , October 29, 2019. [Online]. Available: https://www.statista.com/statistics/1084771/experience-with-aande-department-in-england/
Advertisement
Profit from additional features with an Employee Account
Please create an employee account to be able to mark statistics as favorites.
Then you can access your favorite statistics via the star in the header.
Profit from the additional features of your individual account
Currently, you are using a shared account. To use individual functions (e.g., mark statistics as favourites, set
statistic alerts) please log in with your personal account.
If you are an admin, please authenticate by logging in again.