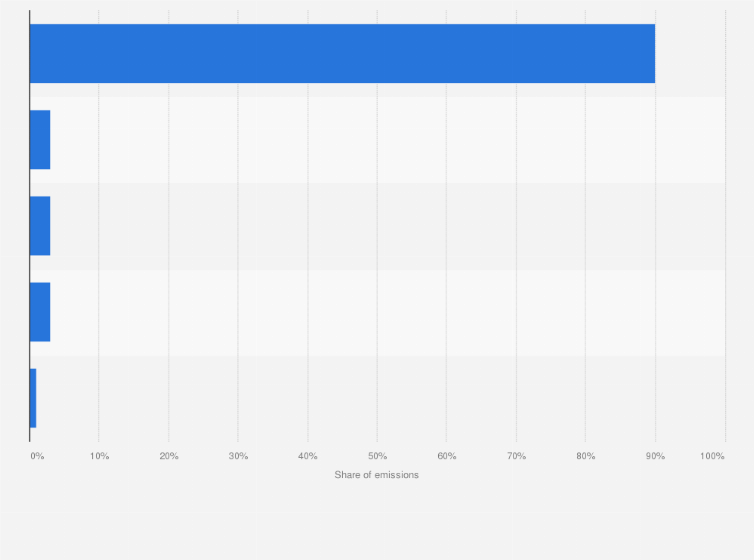
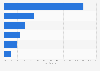
As of 2017, the vast majority of the fluorinated gas emissions in the United States were from substituting ozone-depleting substances, while manufacturing, production and electricity transmission and distribution sources accounted for only ten percent of fluorinated gas emissions.
Adjust the presentation of the statistic and data points.
Share the statistic on social media channels or embed the statistic in your
website using "Embed Code", where available.
Cite this statistic and select one of the following formats: APA, Chicago, Harvard, MLA & Bluebook.
Print the statistic including description and metadata.
Chart type
Distribution of fluorinated gas emissions in the United States in 2017, by source
Share this statistic
You have no right to use this feature.
Make sure to contact us if you are interested in scientific citation.
You can upgrade your account to enable this functionality for all statistics.
This feature is not available with your current account.Request access
Learn more about how Statista can support your business.
Environmental Protection Agency. (April 1, 2019). Distribution of fluorinated gas emissions in the United States in 2017, by source [Graph]. In Statista. Retrieved June 14, 2025, from https://www.statista.com/statistics/1085624/share-emissions-fluorinated-gases-us-by-source/
Environmental Protection Agency. "Distribution of fluorinated gas emissions in the United States in 2017, by source ." Chart. April 1, 2019. Statista. Accessed June 14, 2025. https://www.statista.com/statistics/1085624/share-emissions-fluorinated-gases-us-by-source/
Environmental Protection Agency. (2019). Distribution of fluorinated gas emissions in the United States in 2017, by source . Statista. Statista Inc.. Accessed: June 14, 2025. https://www.statista.com/statistics/1085624/share-emissions-fluorinated-gases-us-by-source/
Environmental Protection Agency. "Distribution of Fluorinated Gas Emissions in The United States in 2017, by Source ." Statista, Statista Inc., 1 Apr 2019, https://www.statista.com/statistics/1085624/share-emissions-fluorinated-gases-us-by-source/
Environmental Protection Agency, Distribution of fluorinated gas emissions in the United States in 2017, by source Statista, https://www.statista.com/statistics/1085624/share-emissions-fluorinated-gases-us-by-source/ (last visited June 14, 2025)
Distribution of fluorinated gas emissions in the United States in 2017, by source [Graph], Environmental Protection Agency, April 1, 2019. [Online]. Available: https://www.statista.com/statistics/1085624/share-emissions-fluorinated-gases-us-by-source/
Advertisement
Profit from additional features with an Employee Account
Please create an employee account to be able to mark statistics as favorites.
Then you can access your favorite statistics via the star in the header.
Profit from the additional features of your individual account
Currently, you are using a shared account. To use individual functions (e.g., mark statistics as favourites, set
statistic alerts) please log in with your personal account.
If you are an admin, please authenticate by logging in again.