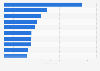
The Netflix series The Witcher, which premiered on December 20th, 2019, saw the biggest demand in the U.S. (39.1 DEx/c) and Poland (where the books and video games originate from, 28.5 DEx/c).
Advertisement
Advertisement
Ranking of regions with the highest demand for The Witcher series in December 2019
(in demand expressions per capita)
Data based on Demand Expressions®: A global metric standard developed by Parrot Analytics which represents the total audience demand being expressed for a title, within a market. Audience demand reflects the desire, engagement and viewership, weighted by importance; so a stream / download is a higher expression of demand than a 'like' / comment."
Profit from the additional features of your individual account
Currently, you are using a shared account. To use individual functions (e.g., mark statistics as favourites, set
statistic alerts) please log in with your personal account.
If you are an admin, please authenticate by logging in again.
Learn more about how Statista can support your business.
Mobirank. (January 4, 2020). Ranking of regions with the highest demand for The Witcher series in December 2019 (in demand expressions per capita) [Graph]. In Statista. Retrieved June 18, 2025, from https://www.statista.com/statistics/1085978/popularity-of-netflix-production-the-witcher-by-region/
Mobirank. "Ranking of regions with the highest demand for The Witcher series in December 2019 (in demand expressions per capita)." Chart. January 4, 2020. Statista. Accessed June 18, 2025. https://www.statista.com/statistics/1085978/popularity-of-netflix-production-the-witcher-by-region/
Mobirank. (2020). Ranking of regions with the highest demand for The Witcher series in December 2019 (in demand expressions per capita). Statista. Statista Inc.. Accessed: June 18, 2025. https://www.statista.com/statistics/1085978/popularity-of-netflix-production-the-witcher-by-region/
Mobirank. "Ranking of Regions with The Highest Demand for The Witcher Series in December 2019 (in Demand Expressions per Capita)." Statista, Statista Inc., 4 Jan 2020, https://www.statista.com/statistics/1085978/popularity-of-netflix-production-the-witcher-by-region/
Mobirank, Ranking of regions with the highest demand for The Witcher series in December 2019 (in demand expressions per capita) Statista, https://www.statista.com/statistics/1085978/popularity-of-netflix-production-the-witcher-by-region/ (last visited June 18, 2025)
Ranking of regions with the highest demand for The Witcher series in December 2019 (in demand expressions per capita) [Graph], Mobirank, January 4, 2020. [Online]. Available: https://www.statista.com/statistics/1085978/popularity-of-netflix-production-the-witcher-by-region/