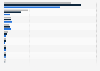
This diagram shows the distribution of the number of Portuguese immigrants living in France in 2019, by age group. In total, France welcomed more than 549,600 Portuguese expatriates in its territory.
Distribution of the number of Portuguese immigrants living in France in 2019, by age group
Profit from the additional features of your individual account
Currently, you are using a shared account. To use individual functions (e.g., mark statistics as favourites, set
statistic alerts) please log in with your personal account.
If you are an admin, please authenticate by logging in again.
Learn more about how Statista can support your business.
Insee. (June 27, 2022). Distribution of the number of Portuguese immigrants living in France in 2019, by age group [Graph]. In Statista. Retrieved May 09, 2025, from https://www.statista.com/statistics/1086047/immigrants-portuguese-by-age-france/
Insee. "Distribution of the number of Portuguese immigrants living in France in 2019, by age group." Chart. June 27, 2022. Statista. Accessed May 09, 2025. https://www.statista.com/statistics/1086047/immigrants-portuguese-by-age-france/
Insee. (2022). Distribution of the number of Portuguese immigrants living in France in 2019, by age group. Statista. Statista Inc.. Accessed: May 09, 2025. https://www.statista.com/statistics/1086047/immigrants-portuguese-by-age-france/
Insee. "Distribution of The Number of Portuguese Immigrants Living in France in 2019, by Age Group." Statista, Statista Inc., 27 Jun 2022, https://www.statista.com/statistics/1086047/immigrants-portuguese-by-age-france/
Insee, Distribution of the number of Portuguese immigrants living in France in 2019, by age group Statista, https://www.statista.com/statistics/1086047/immigrants-portuguese-by-age-france/ (last visited May 09, 2025)
Distribution of the number of Portuguese immigrants living in France in 2019, by age group [Graph], Insee, June 27, 2022. [Online]. Available: https://www.statista.com/statistics/1086047/immigrants-portuguese-by-age-france/