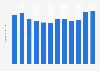
In the fourth quarter of 2024, the average selling price per square meter of Bangkok condominiums in the central business district amounted to approximately 237,000 Thai baht. The city fringe and Bangkok suburbs are also among the popular locations for Bangkok condominiums.
Average selling price per square meter of Bangkok condominiums in central business district in Thailand from 1st quarter 2021 to 4th quarter 2024
(in 1,000 Thai baht)
Characteristic
Average selling price per square meter in thousand Thai baht
Profit from the additional features of your individual account
Currently, you are using a shared account. To use individual functions (e.g., mark statistics as favourites, set
statistic alerts) please log in with your personal account.
If you are an admin, please authenticate by logging in again.
Learn more about how Statista can support your business.
Knight Frank. (March 14, 2025). Average selling price per square meter of Bangkok condominiums in central business district in Thailand from 1st quarter 2021 to 4th quarter 2024 (in 1,000 Thai baht) [Graph]. In Statista. Retrieved June 04, 2025, from https://www.statista.com/statistics/1088078/thailand-average-selling-price-of-bangkok-condominiums-in-cbd/
Knight Frank. "Average selling price per square meter of Bangkok condominiums in central business district in Thailand from 1st quarter 2021 to 4th quarter 2024 (in 1,000 Thai baht)." Chart. March 14, 2025. Statista. Accessed June 04, 2025. https://www.statista.com/statistics/1088078/thailand-average-selling-price-of-bangkok-condominiums-in-cbd/
Knight Frank. (2025). Average selling price per square meter of Bangkok condominiums in central business district in Thailand from 1st quarter 2021 to 4th quarter 2024 (in 1,000 Thai baht). Statista. Statista Inc.. Accessed: June 04, 2025. https://www.statista.com/statistics/1088078/thailand-average-selling-price-of-bangkok-condominiums-in-cbd/
Knight Frank. "Average Selling Price per Square Meter of Bangkok Condominiums in Central Business District in Thailand from 1st Quarter 2021 to 4th Quarter 2024 (in 1,000 Thai Baht)." Statista, Statista Inc., 14 Mar 2025, https://www.statista.com/statistics/1088078/thailand-average-selling-price-of-bangkok-condominiums-in-cbd/
Knight Frank, Average selling price per square meter of Bangkok condominiums in central business district in Thailand from 1st quarter 2021 to 4th quarter 2024 (in 1,000 Thai baht) Statista, https://www.statista.com/statistics/1088078/thailand-average-selling-price-of-bangkok-condominiums-in-cbd/ (last visited June 04, 2025)
Average selling price per square meter of Bangkok condominiums in central business district in Thailand from 1st quarter 2021 to 4th quarter 2024 (in 1,000 Thai baht) [Graph], Knight Frank, March 14, 2025. [Online]. Available: https://www.statista.com/statistics/1088078/thailand-average-selling-price-of-bangkok-condominiums-in-cbd/