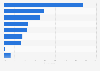
This graph shows French people's preferences in terms of non-cash means of payment in 2017. At that time, around 56 percent of French people stated that they preferred to pay with their bank card.
French people's preferences for non-cash means of payment in 2017
Profit from the additional features of your individual account
Currently, you are using a shared account. To use individual functions (e.g., mark statistics as favourites, set
statistic alerts) please log in with your personal account.
If you are an admin, please authenticate by logging in again.
Learn more about how Statista can support your business.
Banque de France. (May 3, 2019). French people's preferences for non-cash means of payment in 2017 [Graph]. In Statista. Retrieved May 12, 2025, from https://www.statista.com/statistics/1088111/preferences-non-cash-means-of-payment-france/
Banque de France. "French people's preferences for non-cash means of payment in 2017." Chart. May 3, 2019. Statista. Accessed May 12, 2025. https://www.statista.com/statistics/1088111/preferences-non-cash-means-of-payment-france/
Banque de France. (2019). French people's preferences for non-cash means of payment in 2017. Statista. Statista Inc.. Accessed: May 12, 2025. https://www.statista.com/statistics/1088111/preferences-non-cash-means-of-payment-france/
Banque de France. "French People's Preferences for Non-cash Means of Payment in 2017." Statista, Statista Inc., 3 May 2019, https://www.statista.com/statistics/1088111/preferences-non-cash-means-of-payment-france/
Banque de France, French people's preferences for non-cash means of payment in 2017 Statista, https://www.statista.com/statistics/1088111/preferences-non-cash-means-of-payment-france/ (last visited May 12, 2025)
French people's preferences for non-cash means of payment in 2017 [Graph], Banque de France, May 3, 2019. [Online]. Available: https://www.statista.com/statistics/1088111/preferences-non-cash-means-of-payment-france/