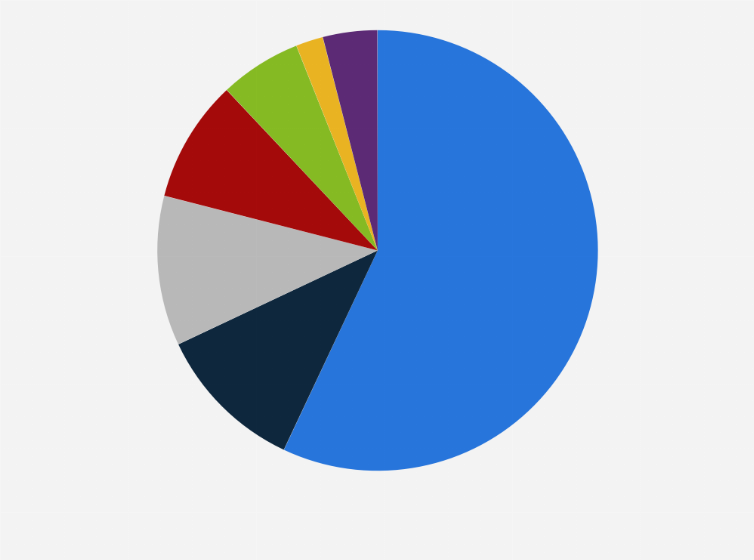
In which out-of-home channels are the most apples used? According to this statistic, nearly 60 percent of all apples sold for out-of-home consumption were used by company caterers. By comparison, institutional facilities, such as prisons and retirement homes, were responsible for roughly ten percent of the total sales volume.
Out-of-home sales volume distribution of apples in the Netherlands 2019, by category
Adjust the presentation of the statistic and data points.
Share the statistic on social media channels or embed the statistic in your
website using "Embed Code", where available.
Cite this statistic and select one of the following formats: APA, Chicago, Harvard, MLA & Bluebook.
Print the statistic including description and metadata.
Chart type
Out-of-home sales volume distribution of apples in the Netherlands 2019, by category
Share this statistic
You have no right to use this feature.
Make sure to contact us if you are interested in scientific citation.
You can upgrade your account to enable this functionality for all statistics.
This feature is not available with your current account.Request access
Learn more about how Statista can support your business.
GroentenFruit Huis. (January 9, 2020). Out-of-home sales volume distribution of apples in the Netherlands 2019, by category [Graph]. In Statista. Retrieved June 02, 2025, from https://www.statista.com/statistics/1088551/apples-out-of-home-sales-volume-in-the-netherlands-by-category/
GroentenFruit Huis. "Out-of-home sales volume distribution of apples in the Netherlands 2019, by category." Chart. January 9, 2020. Statista. Accessed June 02, 2025. https://www.statista.com/statistics/1088551/apples-out-of-home-sales-volume-in-the-netherlands-by-category/
GroentenFruit Huis. (2020). Out-of-home sales volume distribution of apples in the Netherlands 2019, by category. Statista. Statista Inc.. Accessed: June 02, 2025. https://www.statista.com/statistics/1088551/apples-out-of-home-sales-volume-in-the-netherlands-by-category/
GroentenFruit Huis. "Out-of-home Sales Volume Distribution of Apples in The Netherlands 2019, by Category." Statista, Statista Inc., 9 Jan 2020, https://www.statista.com/statistics/1088551/apples-out-of-home-sales-volume-in-the-netherlands-by-category/
GroentenFruit Huis, Out-of-home sales volume distribution of apples in the Netherlands 2019, by category Statista, https://www.statista.com/statistics/1088551/apples-out-of-home-sales-volume-in-the-netherlands-by-category/ (last visited June 02, 2025)
Out-of-home sales volume distribution of apples in the Netherlands 2019, by category [Graph], GroentenFruit Huis, January 9, 2020. [Online]. Available: https://www.statista.com/statistics/1088551/apples-out-of-home-sales-volume-in-the-netherlands-by-category/
Profit from additional features with an Employee Account
Please create an employee account to be able to mark statistics as favorites.
Then you can access your favorite statistics via the star in the header.
Profit from the additional features of your individual account
Currently, you are using a shared account. To use individual functions (e.g., mark statistics as favourites, set
statistic alerts) please log in with your personal account.
If you are an admin, please authenticate by logging in again.