When the all-time Summer Olympic medal table is re-organized to show the average number of medals per tournament, the most successful team is the Soviet Union, who won an average of 112 medals per Olympic Games. The Soviet Union also has the highest number of each medal, with 44 golds, 36 silver and 33 bronze medals. The leaders of the overall medal table, the United States, are in second place, with just over 93 medals per tournament, however they have competed in 27 out of 28 Olympic Games, while the Soviet Union competed in just 10 Olympic Games (including the 1992 Barcelona Olympics, where athletes from ex-Soviet nations participated as one Unified Team).
Another factor that skews the data, is the fact that there were much fewer events (and therefore medals) on offer in earlier tournaments, which lowers the average of countries who have participated in more tournaments. For example, the total number of events was just 150 in the 1960 Games in Rome, while the number of events since 2000 has consistently remained over 300.
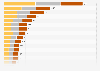
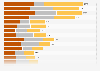
Average number of total medals and gold medals won per game at the Summer Olympics from 1896 to 2020, by country
Country (number of Summer Olympics participated in)
Gold
Silver
Bronze
Soviet Union (10)*/**
44
35.7
32.5
United States (28)
37.89
29.86
26.36
East Germany (5)*
30.6
25.8
25.4
Russia (6)*****
24.67
20.83
25.5
China (11)
23.82
18.09
15.73
West Germany (5)*
11.2
13.4
16.2
Germany (20)***
11.45
12.95
14.1
Great Britain (29)
9.83
10.9
10.86
France (29)
7.66
8.72
9.45
Japan (23)
7.35
6.52
7.74
Italy (29)
7.45
6.48
7.34
Ukraine (7)
5
5.14
9.71
Australia (29)
5.76
6
7.31
0102030405060708090100110120130
Add this content to your personal favorites. These can be accessed from the favorites menu in the main navigation.
You have no right to use this feature.
Make sure to contact us if you are interested in scientific citation.
You can upgrade your account to enable this functionality for all statistics.
This feature is not available with your current account.Request access
This data was collected using the official Olympic.org site, as well as a spreadsheet from the Guardian that includes data from 1896-2008 (available here), 2012 and 2016 data was compared with that from Encyclopaedia Britannica, and several news outlets were used to update the table when medals were reassigned (i.e. for doping offenses).
*No longer exists/competes at the Olympics.
**Includes medals from the Unified Team in the 1992 Olympics; made up of all athletes from former-Soviet countries, excluding the Baltic States. Does not include medals won by Russia or the Russian Empire, whose medals are included in separate entries. The combined total of Russia, the Russian Empire and Soviet Union is 1,556 medals (589 gold, 486 silver and 481 bronze).
***Does not include medals won by athletes representing the Russian Olympic Committee in the 2020 Games.
****Includes medals from the united German teams of the 1956, 1960 and 1964 Olympics, but does not include medals from East Germany or West Germany, whose medals are included in separate entries. The combined total of Germany, East Germany and West Germany is 1,346 medals (428 gold, 444 silver and 474 bronze).
Learn more about how Statista can support your business.
Statista estimates. (August 17, 2021). Average number of total medals and gold medals won per game at the Summer Olympics from 1896 to 2020, by country [Graph]. In Statista. Retrieved May 08, 2025, from https://www.statista.com/statistics/1101834/summer-olympics-average-medals-since-1892/
Statista estimates. "Average number of total medals and gold medals won per game at the Summer Olympics from 1896 to 2020, by country." Chart. August 17, 2021. Statista. Accessed May 08, 2025. https://www.statista.com/statistics/1101834/summer-olympics-average-medals-since-1892/
Statista estimates. (2021). Average number of total medals and gold medals won per game at the Summer Olympics from 1896 to 2020, by country. Statista. Statista Inc.. Accessed: May 08, 2025. https://www.statista.com/statistics/1101834/summer-olympics-average-medals-since-1892/
Statista estimates. "Average Number of Total Medals and Gold Medals Won per Game at The Summer Olympics from 1896 to 2020, by Country." Statista, Statista Inc., 17 Aug 2021, https://www.statista.com/statistics/1101834/summer-olympics-average-medals-since-1892/
Statista estimates, Average number of total medals and gold medals won per game at the Summer Olympics from 1896 to 2020, by country Statista, https://www.statista.com/statistics/1101834/summer-olympics-average-medals-since-1892/ (last visited May 08, 2025)
Average number of total medals and gold medals won per game at the Summer Olympics from 1896 to 2020, by country [Graph], Statista estimates, August 17, 2021. [Online]. Available: https://www.statista.com/statistics/1101834/summer-olympics-average-medals-since-1892/
Profit from additional features with an Employee Account
Please create an employee account to be able to mark statistics as favorites.
Then you can access your favorite statistics via the star in the header.
Profit from the additional features of your individual account
Currently, you are using a shared account. To use individual functions (e.g., mark statistics as favourites, set
statistic alerts) please log in with your personal account.
If you are an admin, please authenticate by logging in again.